CHEM 548: Materials Chemistry

Lecture 18: Band Structures of Transition Metal Oxides

Wed 11/04/2026 · Meeting 20

ReO₃ and perovskite band structures, periodic trends, and an introduction to electrical conductivity

Reading: Woodward, Karen, Evans, and Vogt, Solid State Materials Chemistry
Ch. 6; Ch. 10 §10.1

Learning Objectives: TM Oxide Band Structures

Band Structures of Transition Metal Oxides

  • Describe the crystal structure of ReO₃ and its relationship to perovskite structures
  • Construct band structure diagrams from molecular orbital diagrams for octahedral transition metal complexes
  • Identify and interpret oxygen 2p bands and metal d bands (π* and σ*) at special k-points
  • Extract key energetic parameters from band structures: octahedral ligand field splitting, charge transfer energy, and band gap
  • Predict periodic trends in band structure when moving across the periodic table (changing electronegativity and covalency)
  • Analyze the competing effects of spatial overlap versus energetic overlap when moving down the periodic table (3d vs 4d vs 5d)

Electronic Band Structures | Materials Science & Chemistry

Electronic Band Structure
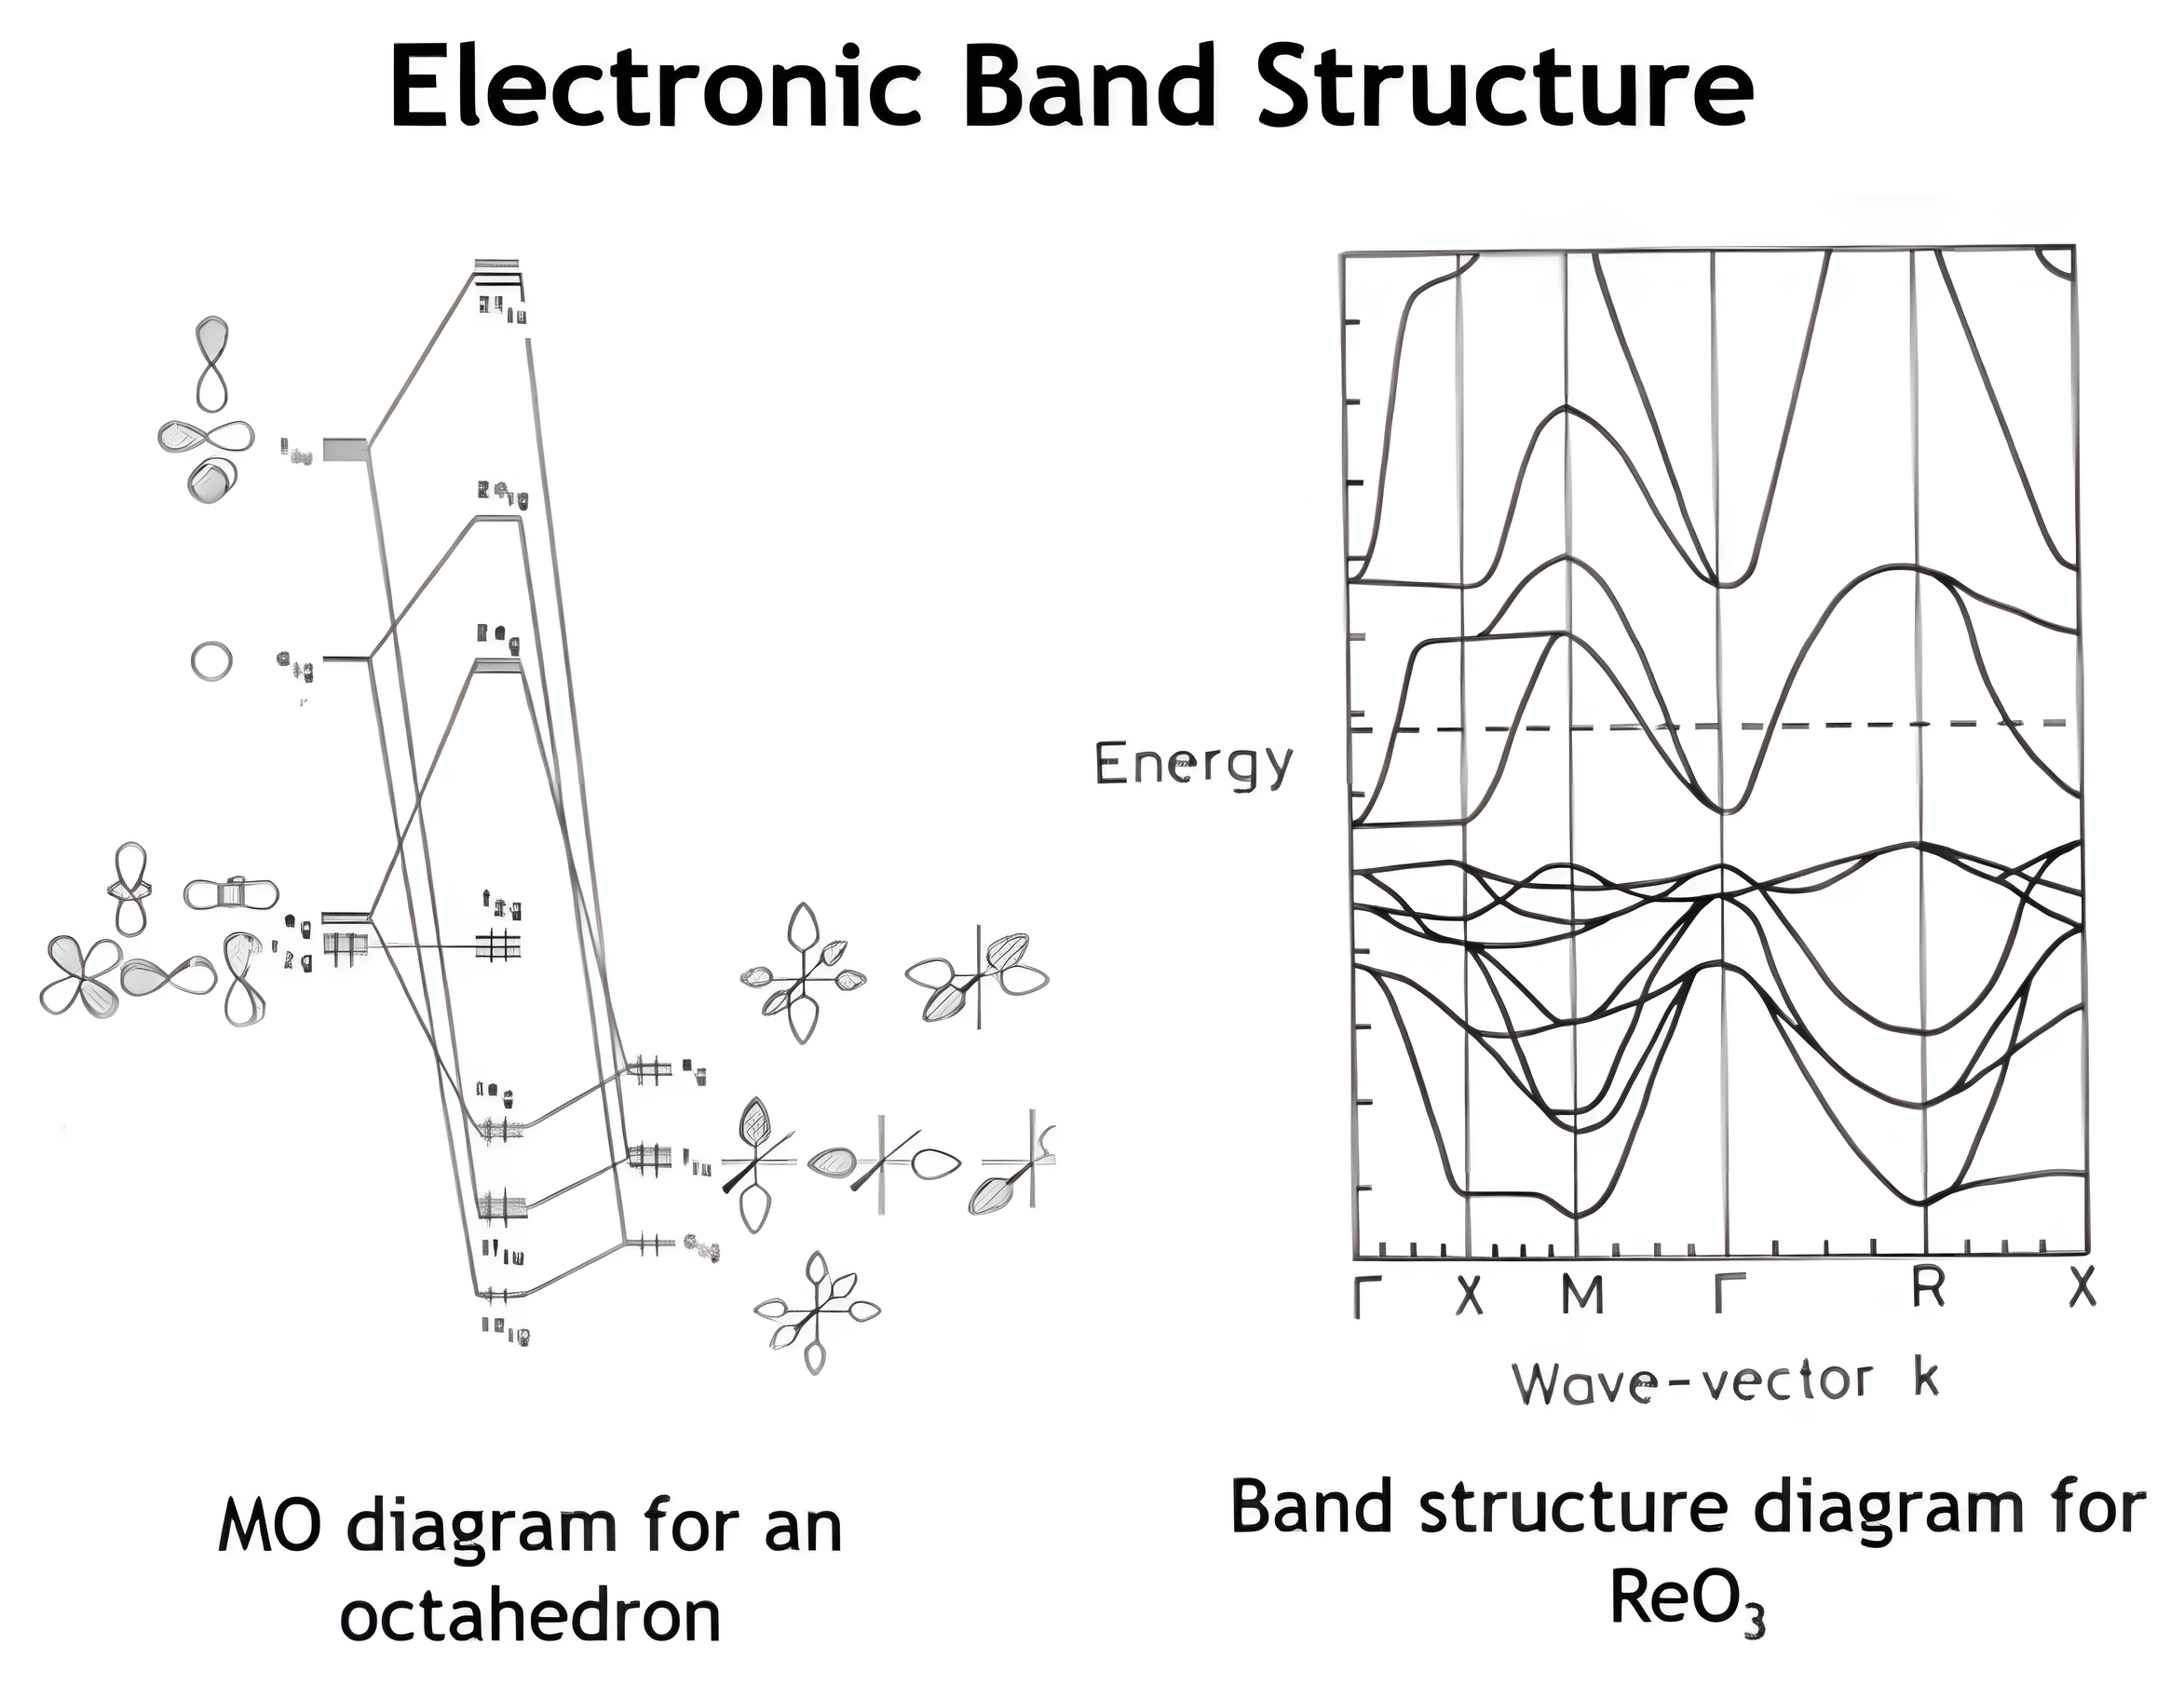
The molecular orbital diagram for an octahedron next to the calculated band structure diagram for ReO3.

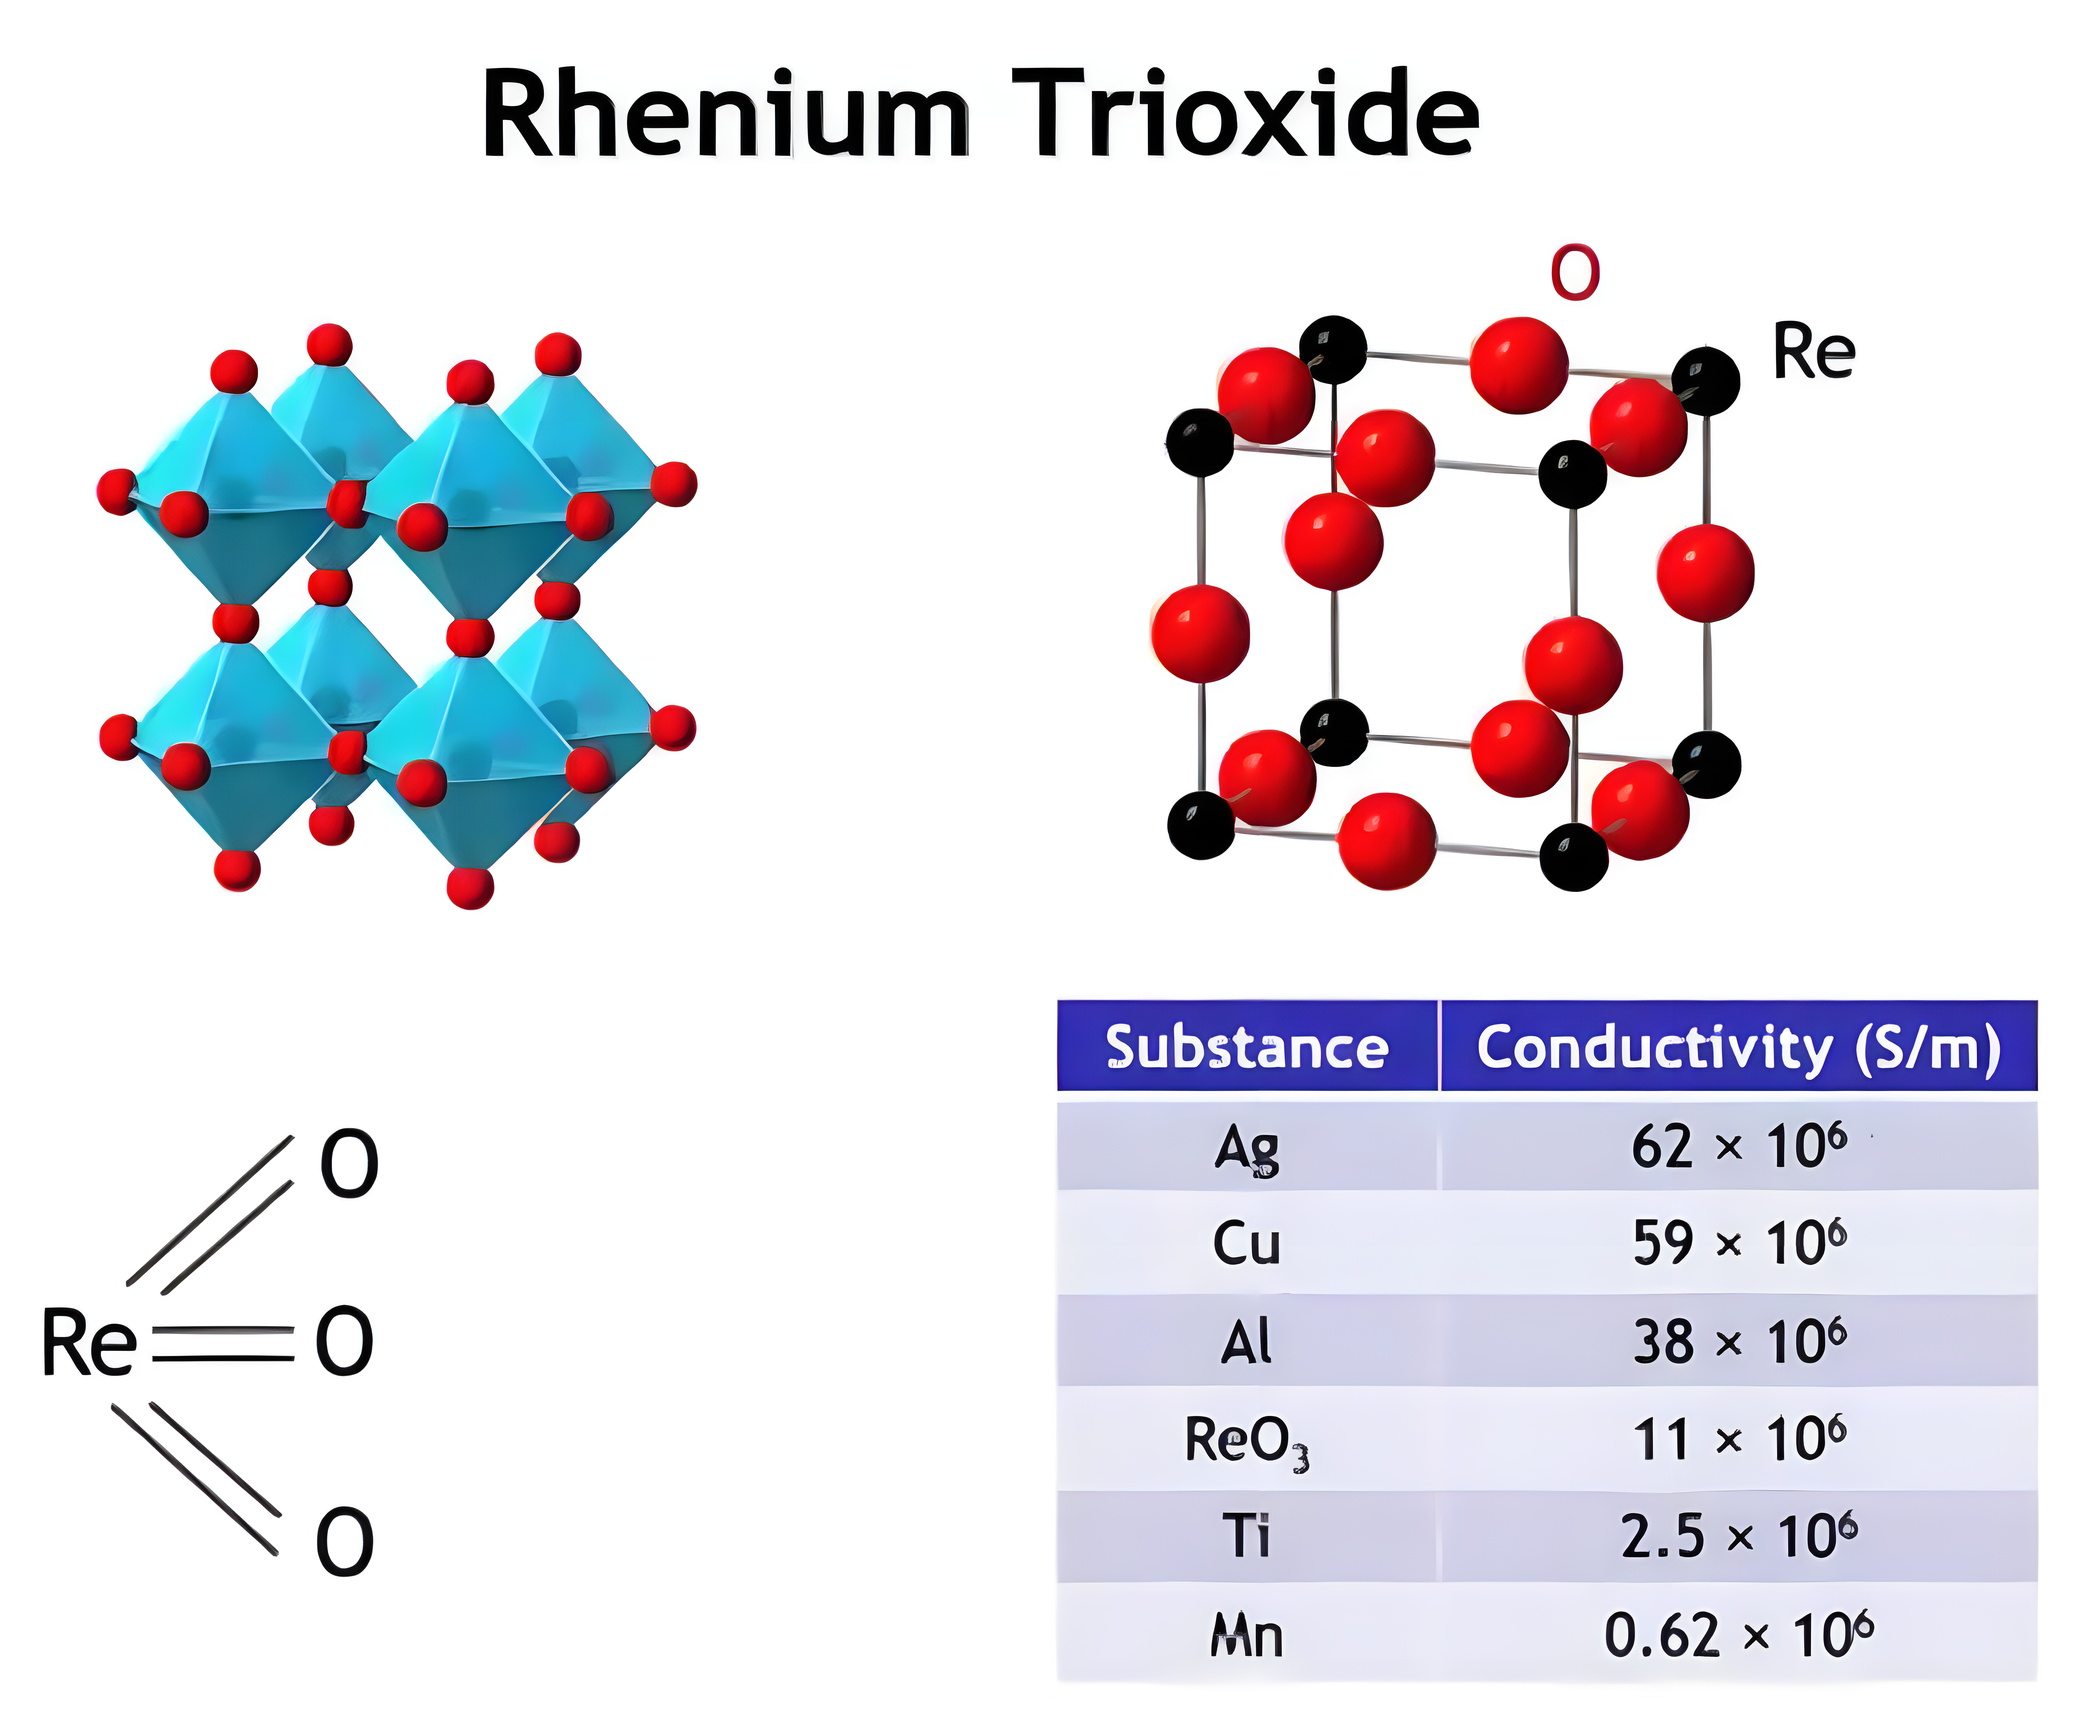
Rhenium Trioxide

The ReO3 structure as corner-connected octahedra and as a unit cell drawing, the Re=O bonding sketch, and a table comparing the conductivity of ReO3 with Ag, Cu, Al, Ti, and Mn.

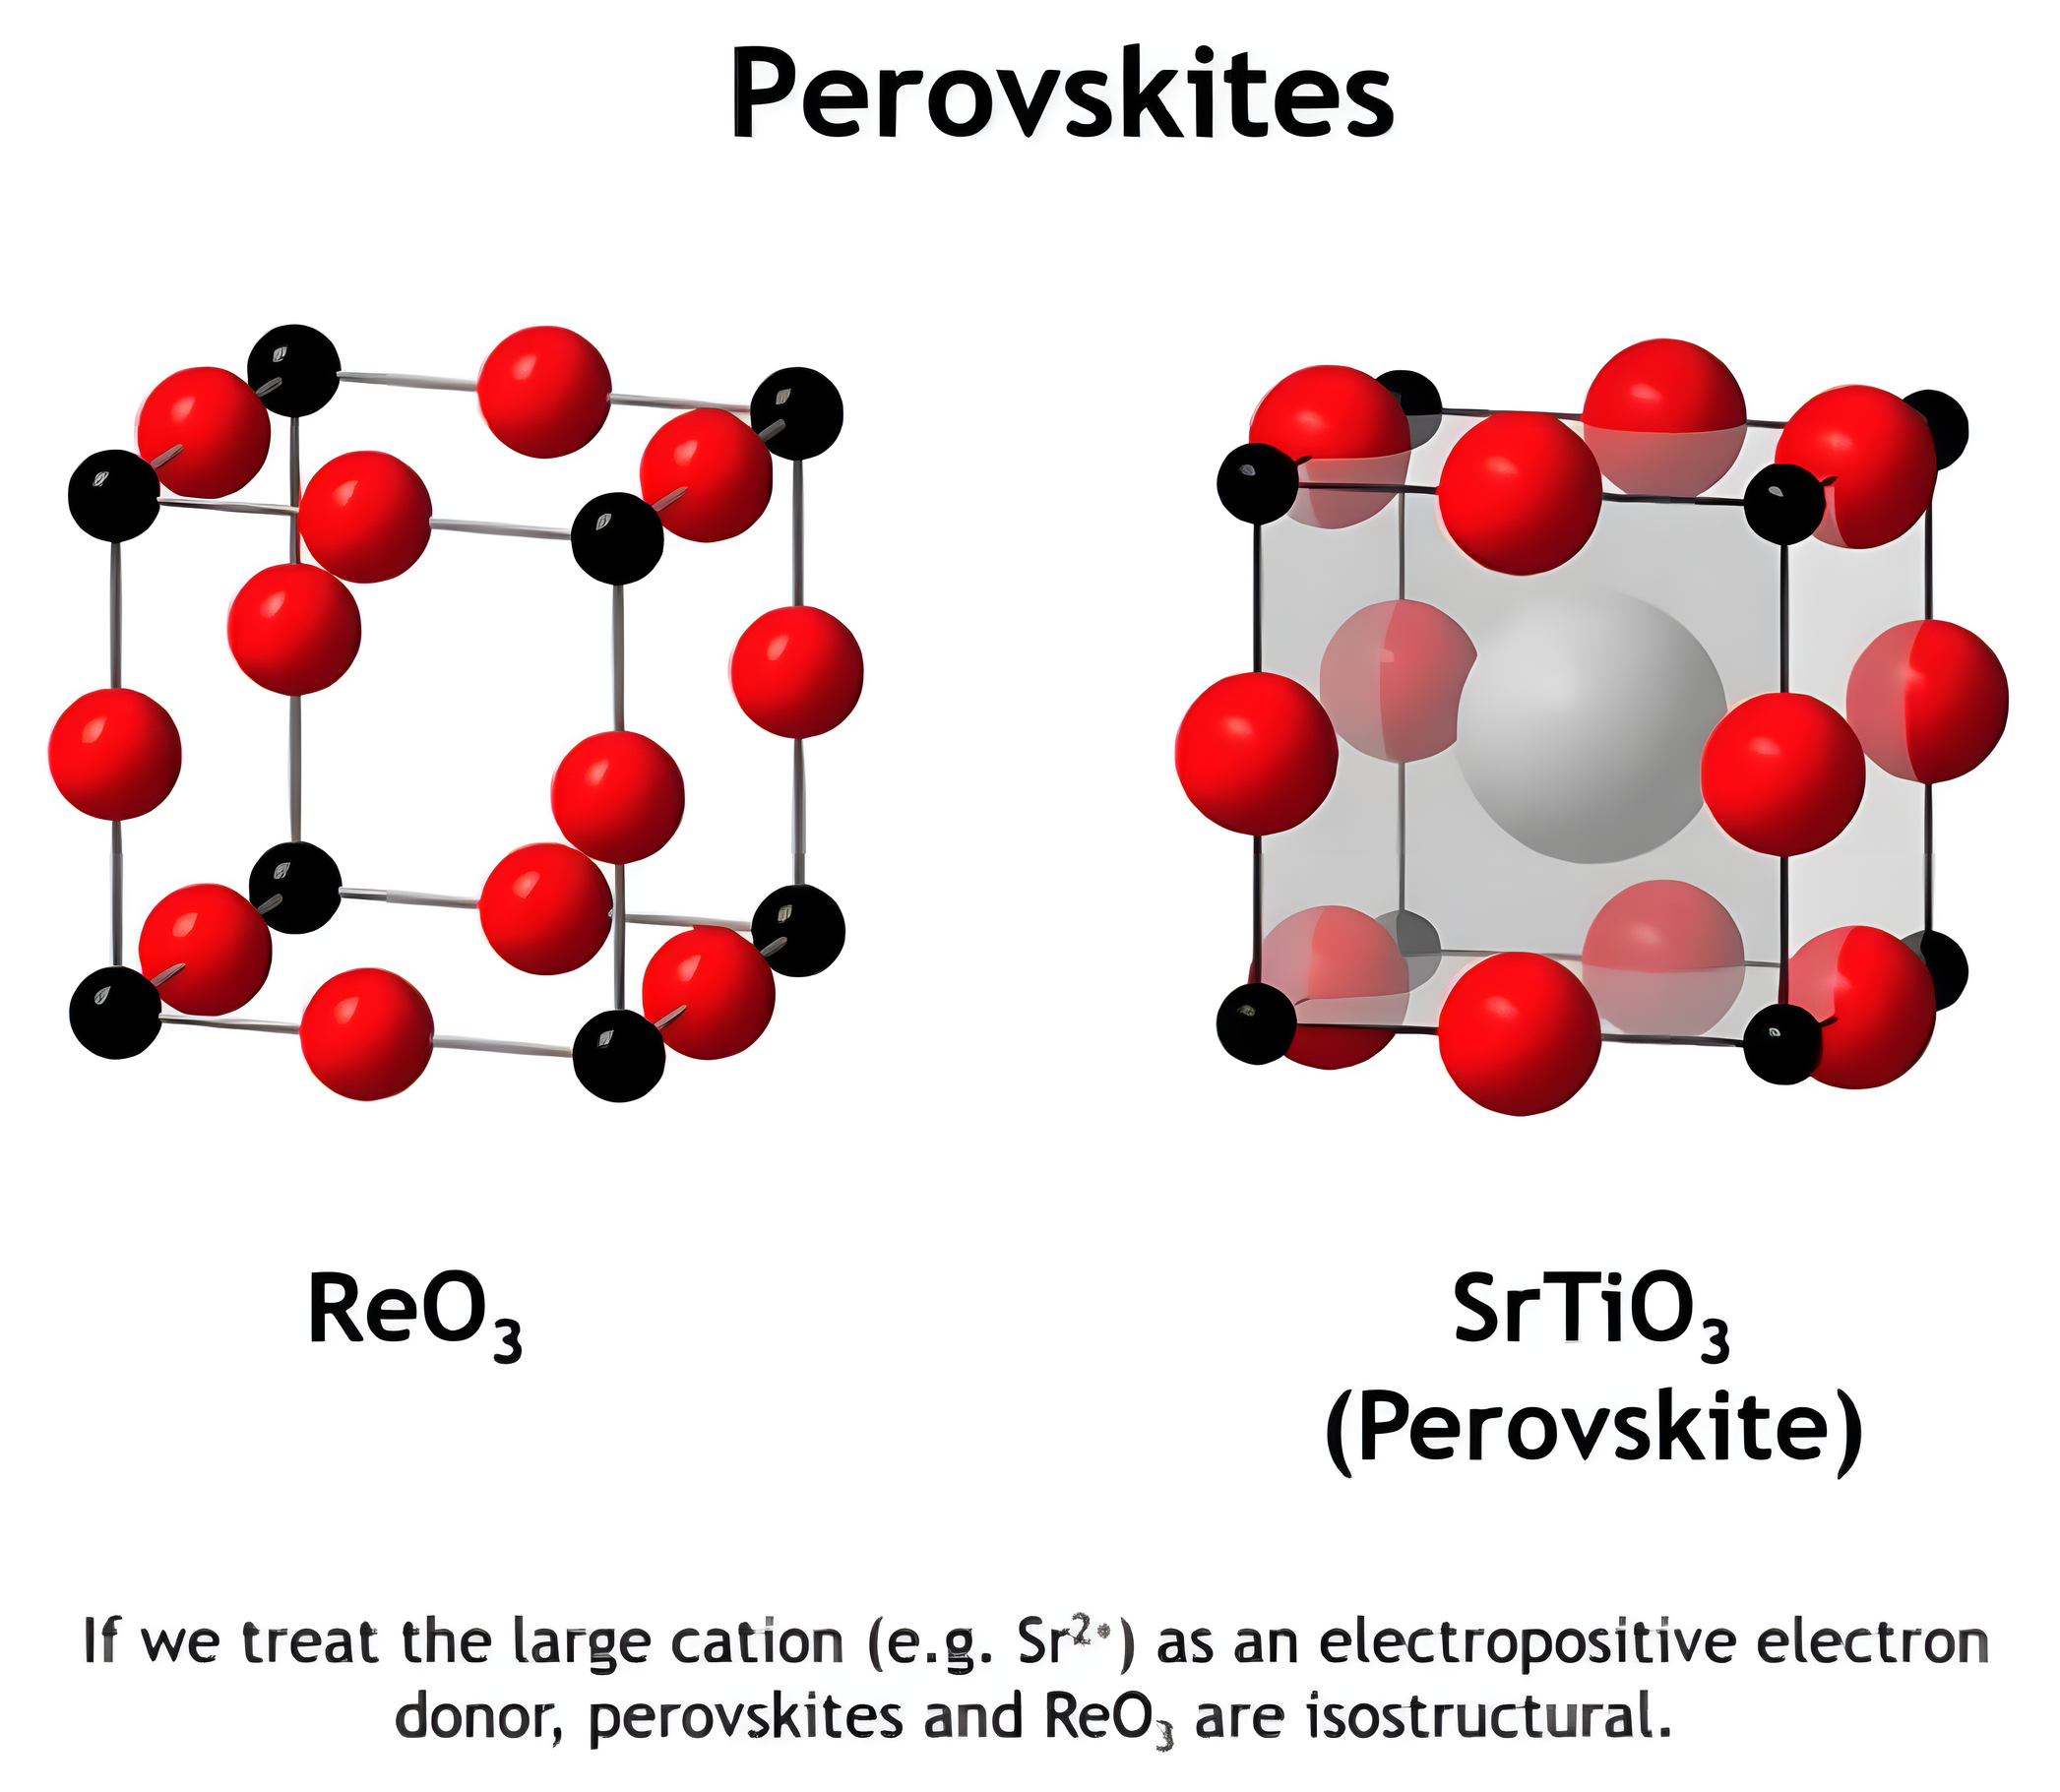
Perovskites

The ReO3 unit cell next to the SrTiO3 perovskite unit cell, which adds a large Sr cation at the cell center; treating the large cation as an electron donor makes the two isostructural.

First Brillouin Zone – Primitive Cubic
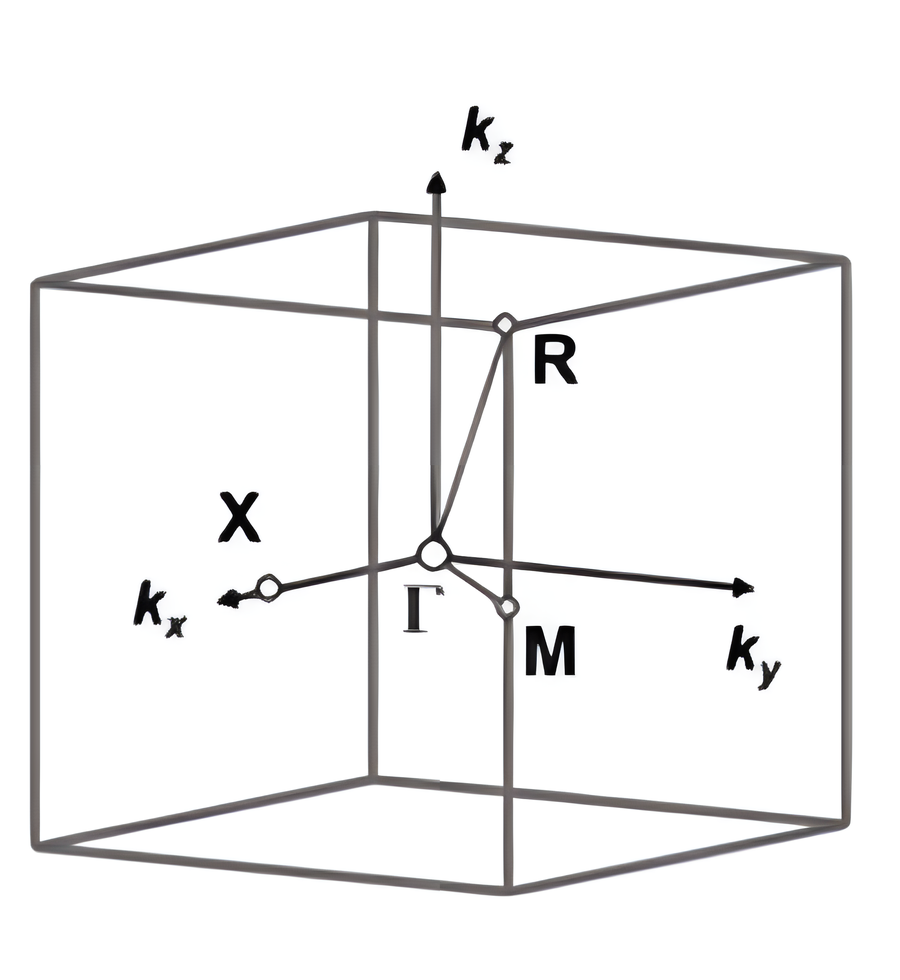
The first Brillouin zone of a primitive cubic lattice drawn as a cube, with the special points Gamma at the centre, X along kx, M in the kx-ky plane, and R at the cube corner.
labelcoordinates
Γ0a* + 0b* + 0c*
X(1/2)a* + 0b* + 0c*
M(1/2)a* + (1/2)b* + 0c*
R(1/2)a* + (1/2)b* + (1/2)c*
labelwave vector (Cartesian)
Γ0kx + 0ky + 0kz
X(π/a)kx + 0ky + 0kz
M(π/a)kx + (π/a)ky + 0kz
R(π/a)kx + (π/a)ky + (π/a)kz

The zone boundary lies at half of each reciprocal lattice vector, where $k = \pi/a$. Per Solid State Materials Chemistry, §6.4.

MO Diagram for the ReO₆⁶⁻ Octahedron
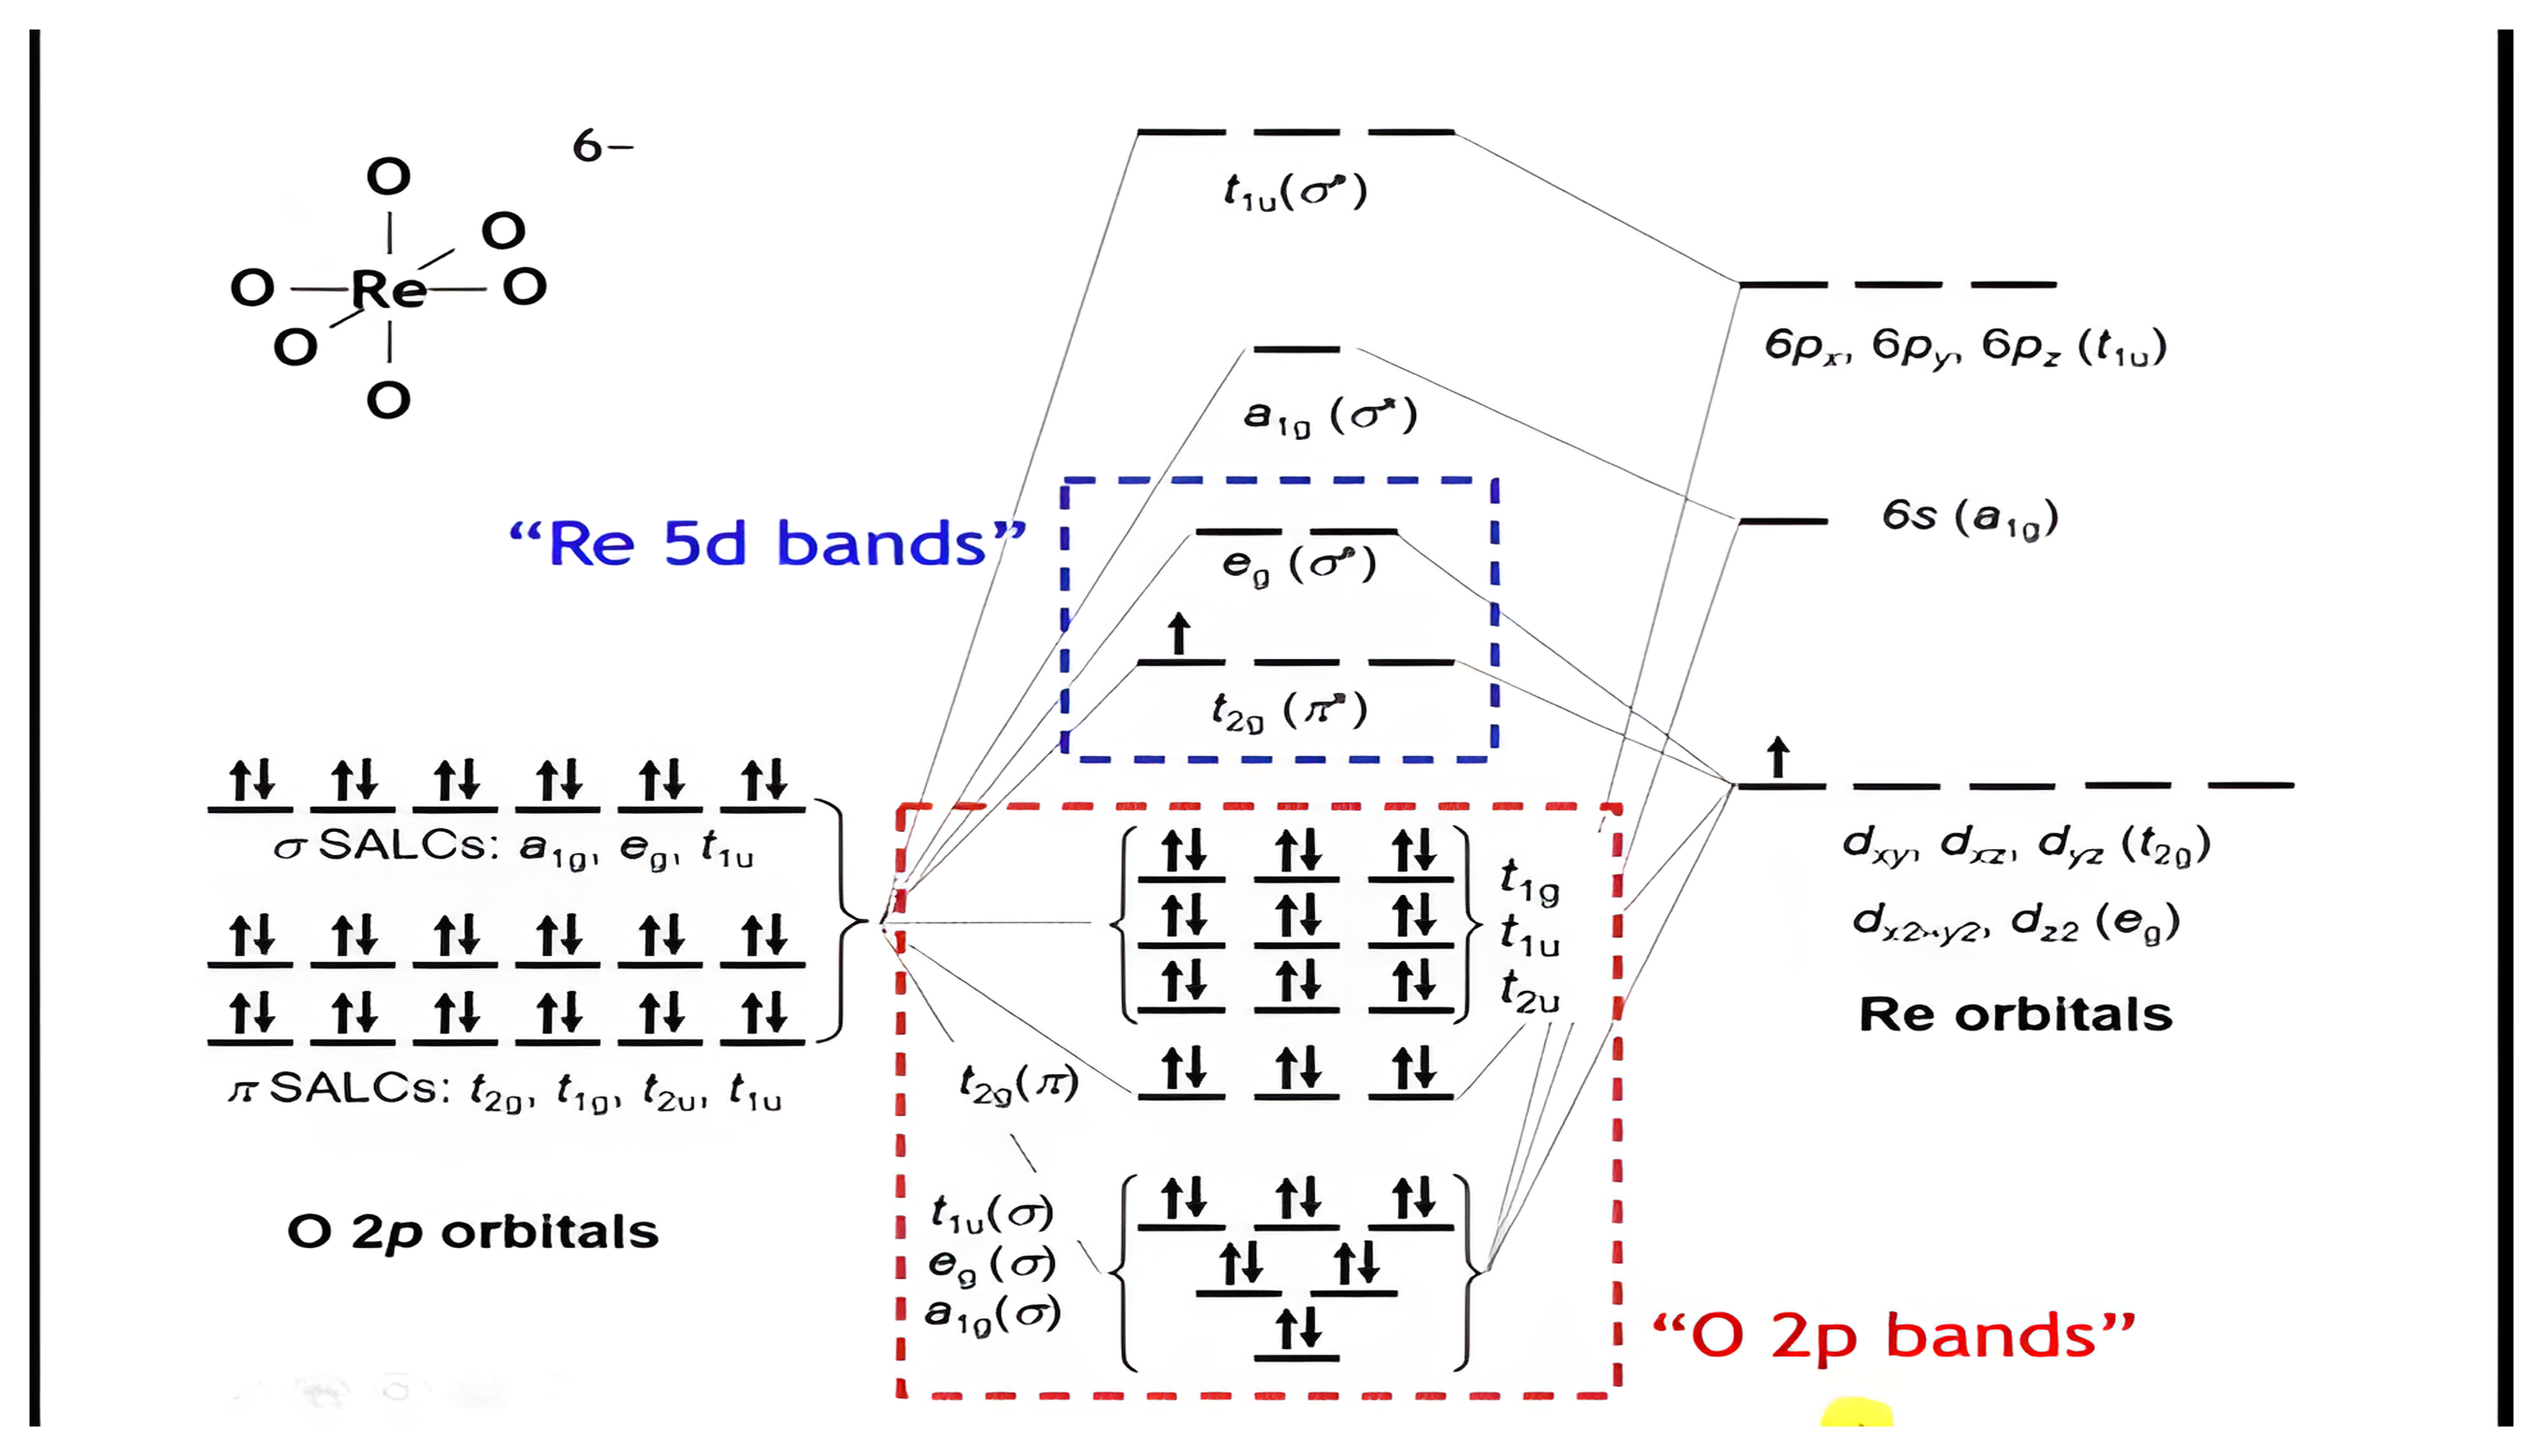
The molecular orbital diagram for a ReO6 octahedron with the oxygen 2p SALCs on the left, the rhenium orbitals on the right, and boxes marking the Re 5d bands and the O 2p bands.

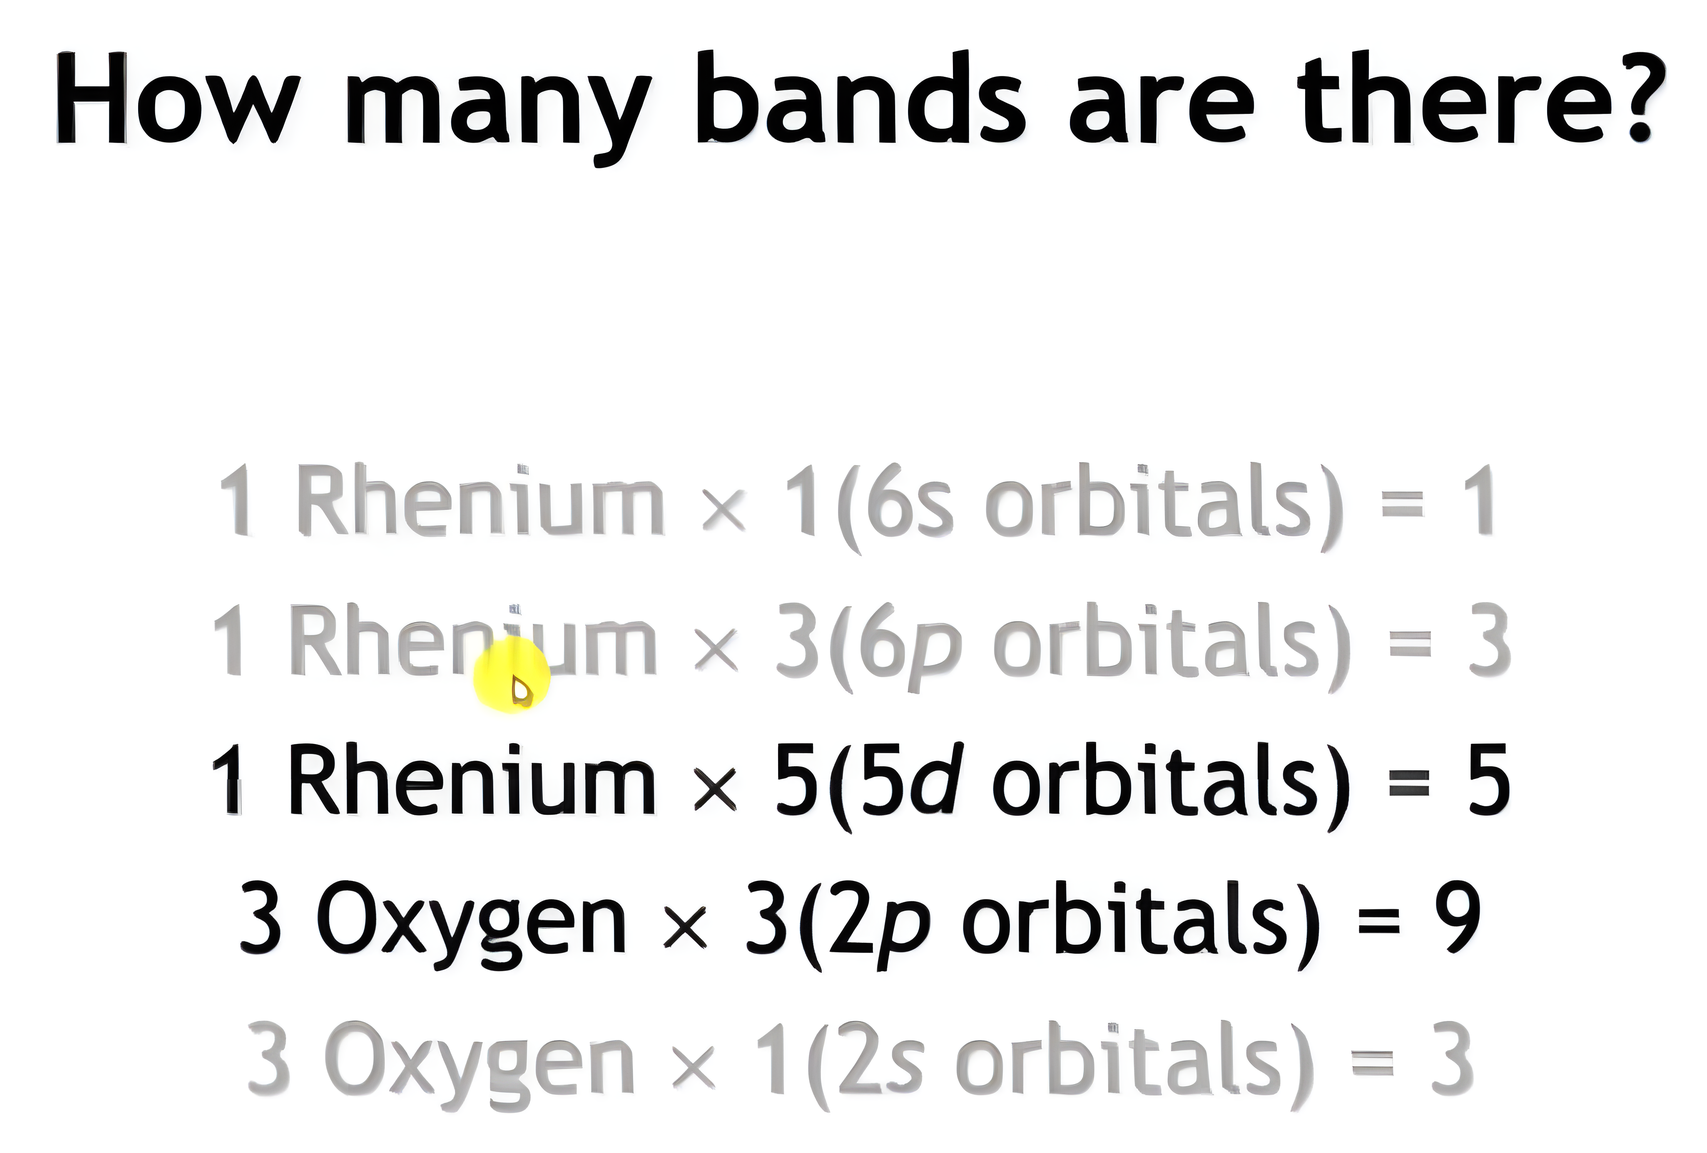
How Many Bands Are There?

Counting bands in ReO3: one rhenium contributes one 6s, three 6p, and five 5d orbitals; three oxygens contribute nine 2p and three 2s orbitals; the 5d and 2p rows are highlighted.

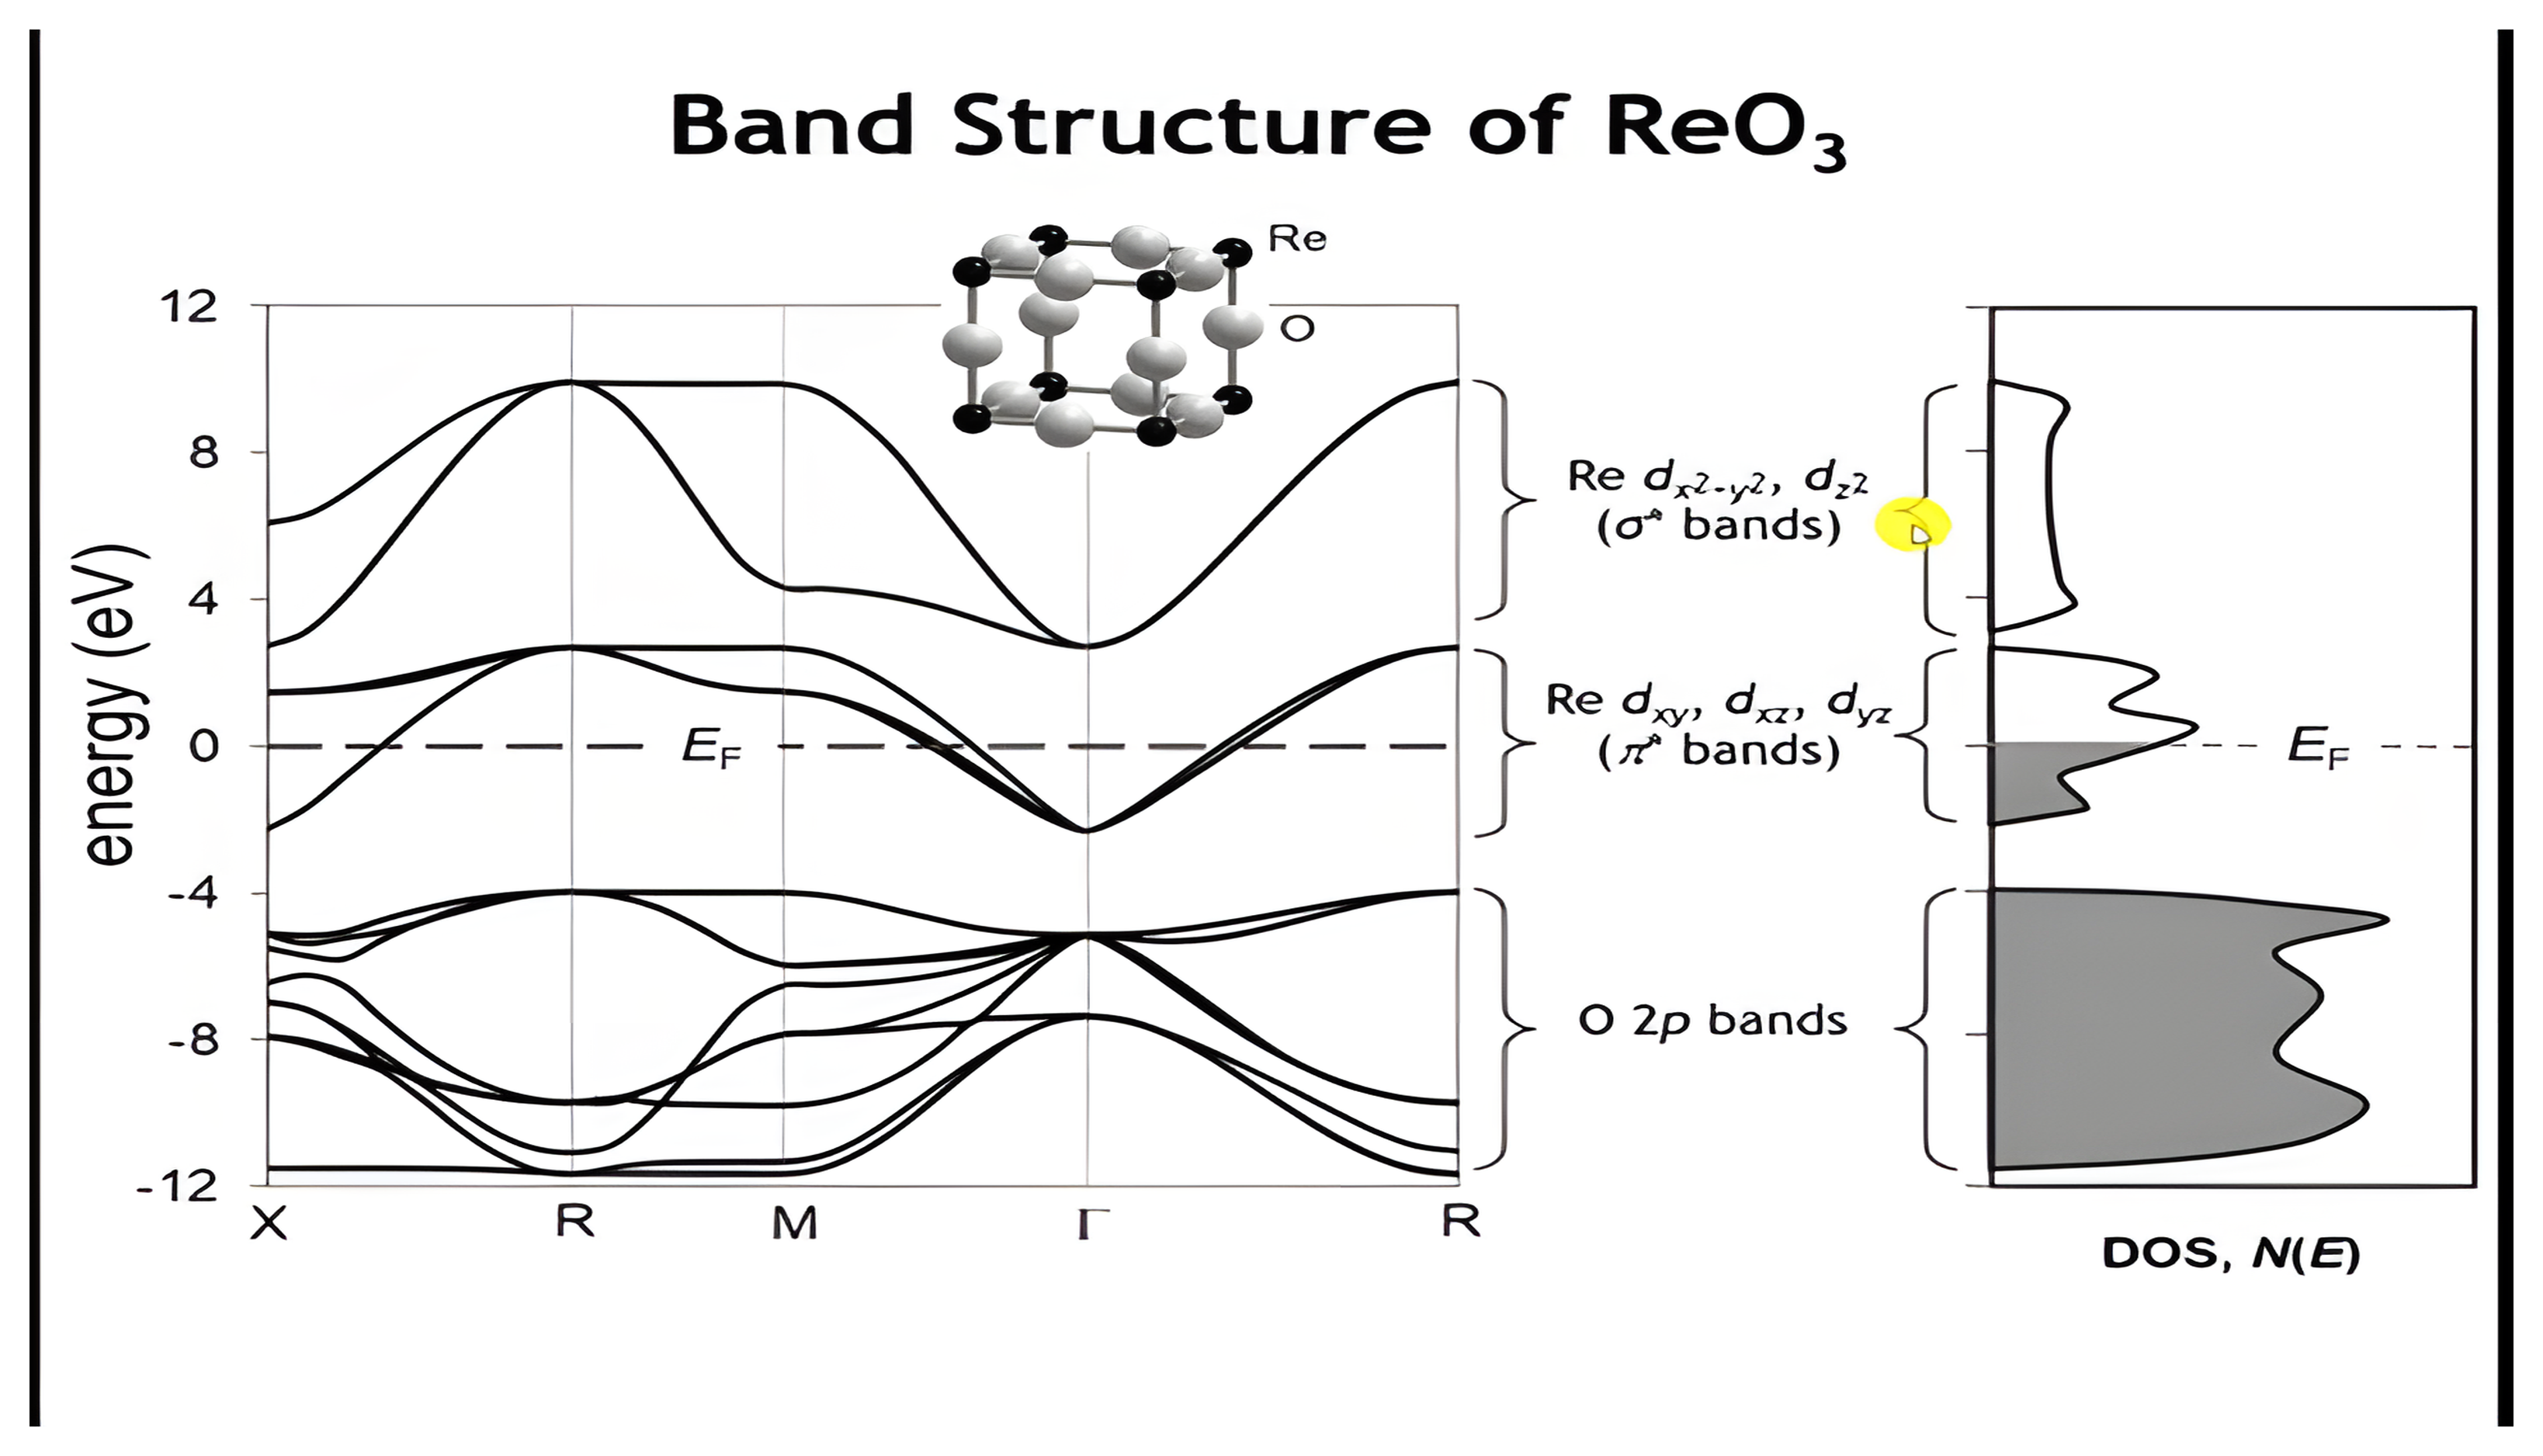
Band Structure of ReO₃

The calculated band structure of ReO3 along X, R, M, Gamma, R with the ReO3 unit cell inset, labeled Re eg sigma-star bands, Re t2g pi-star bands, and O 2p bands, next to the density of states with the Fermi level in the pi-star bands.

Orbital Overlap: Re 5d (eg) σ* Bands

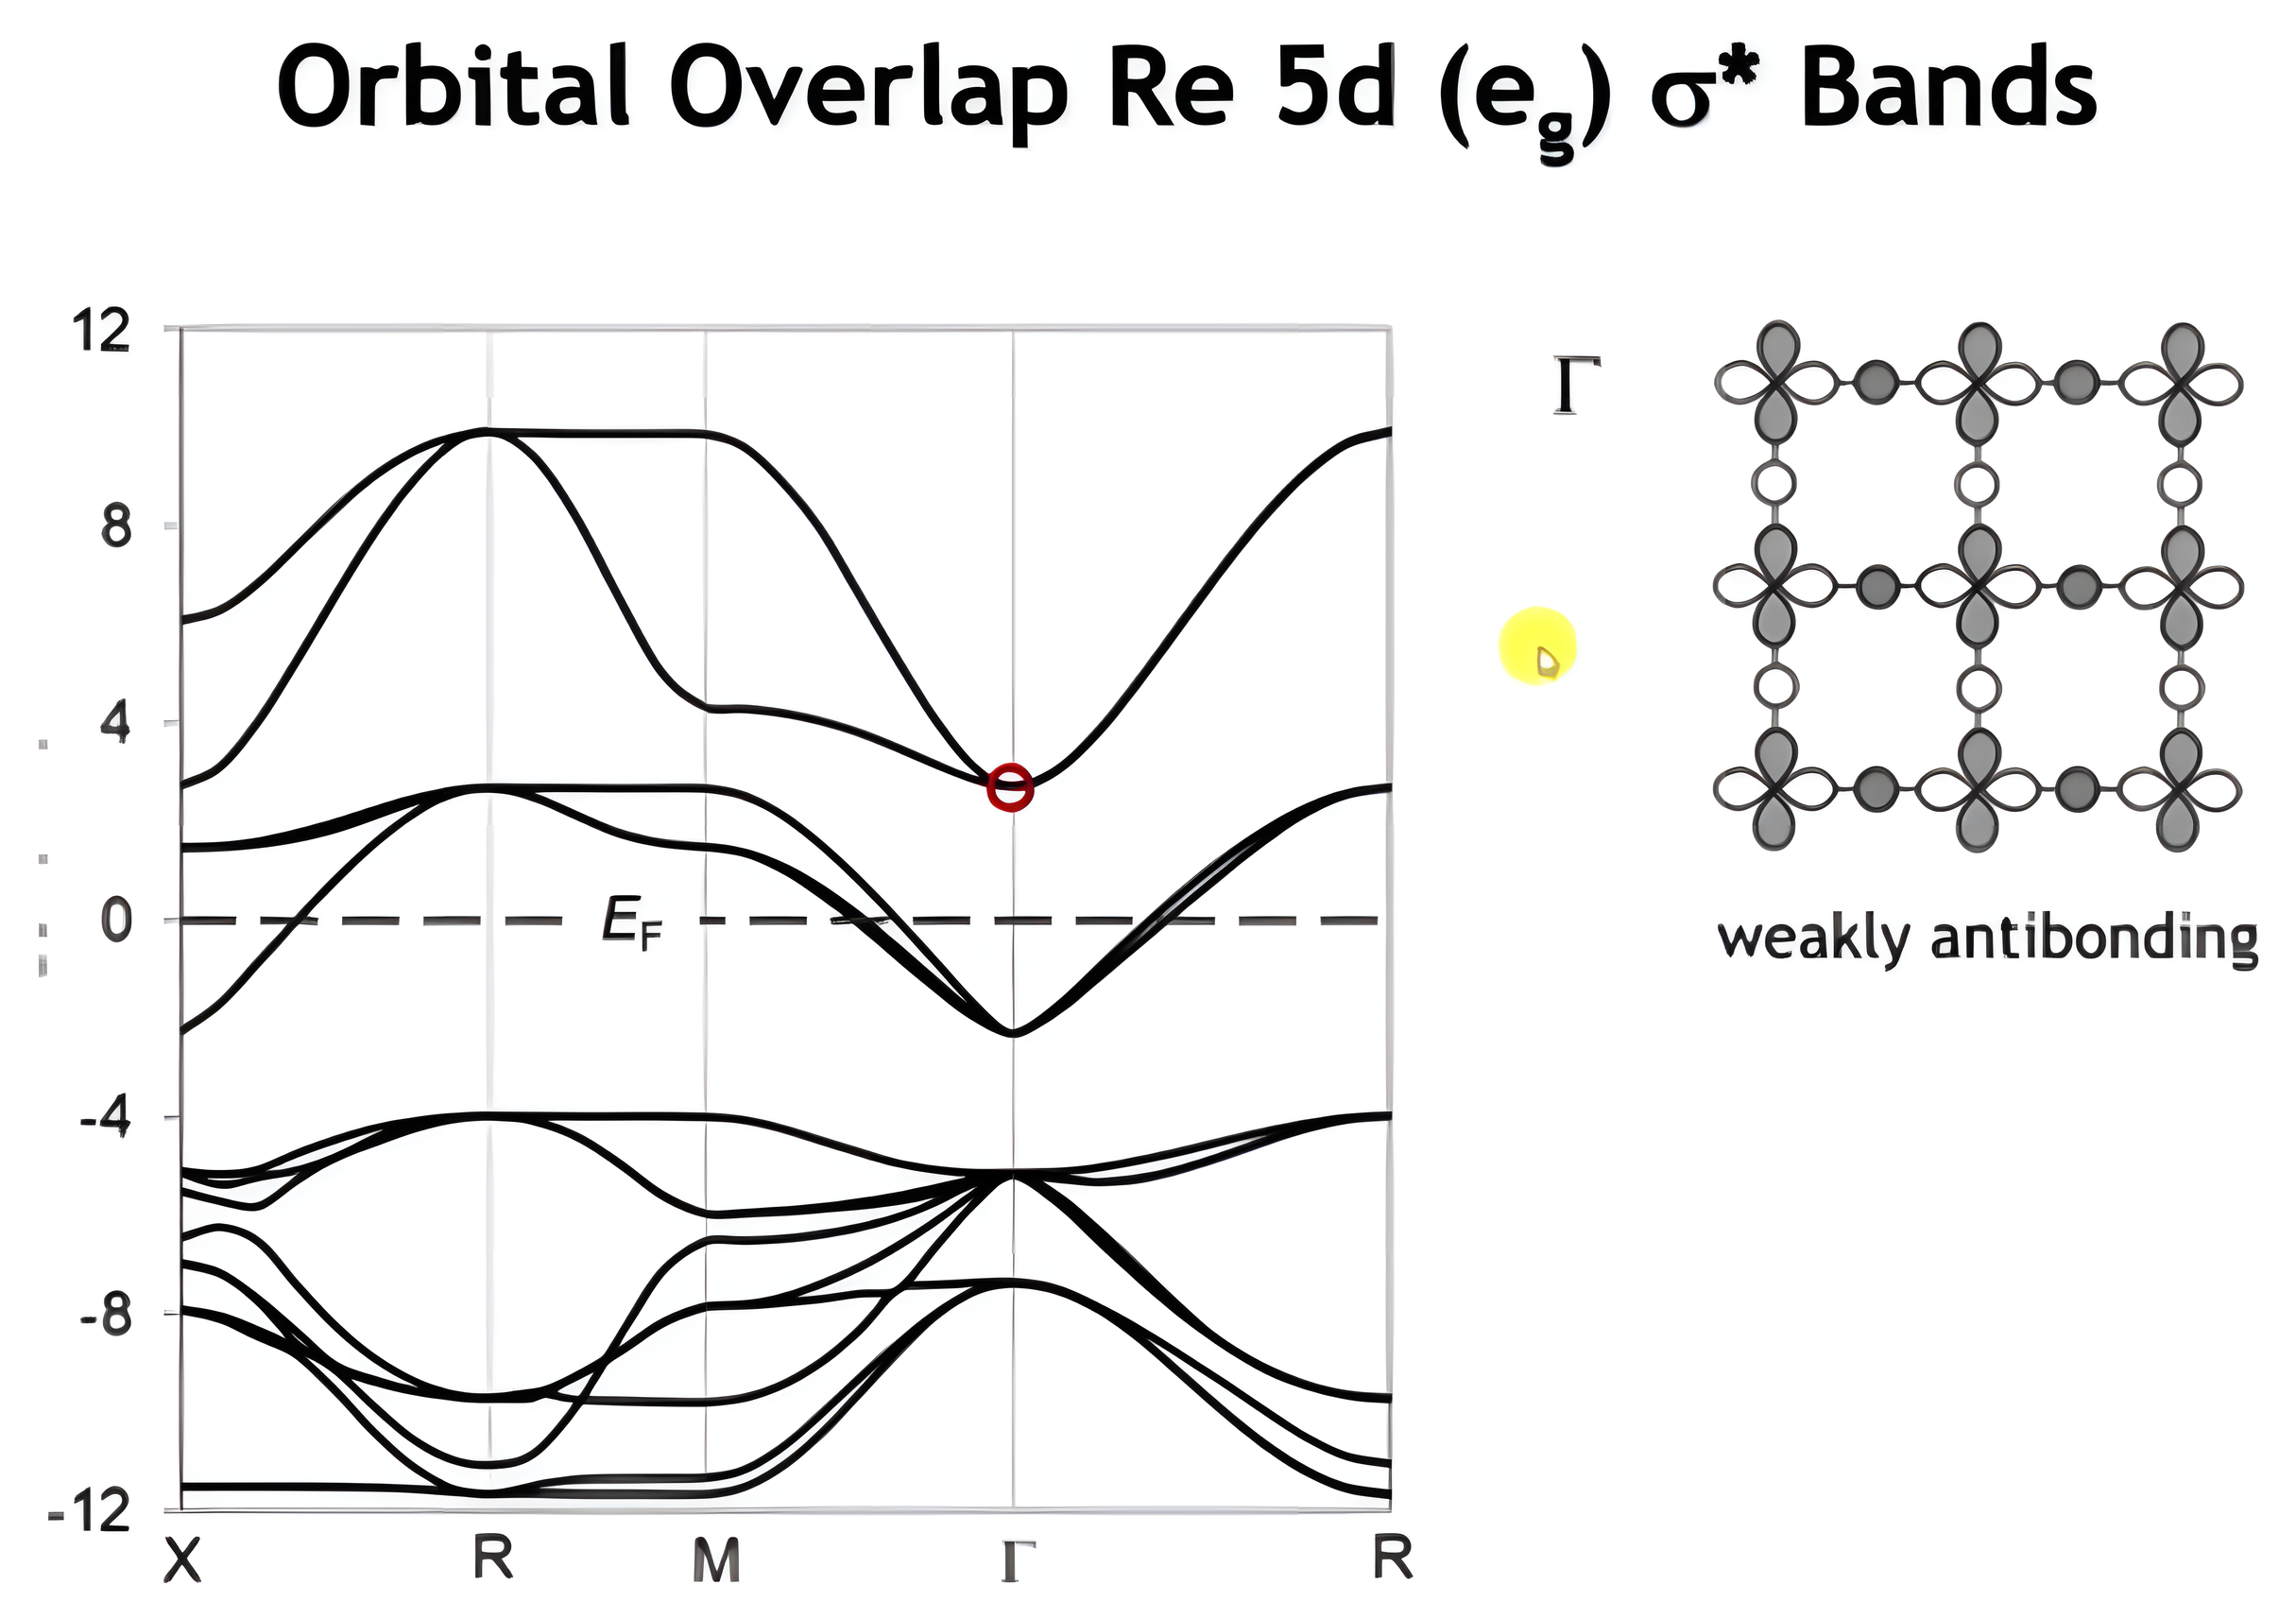
The ReO3 band structure with the sigma-star band circled at Gamma and the weakly antibonding crystal orbital drawn; a click adds the strongly antibonding crystal orbital at M, and a second click labels the dx2-y2 and dz2 bands on the plot.

Orbital Overlap: Re 5d (t2g) π* Bands
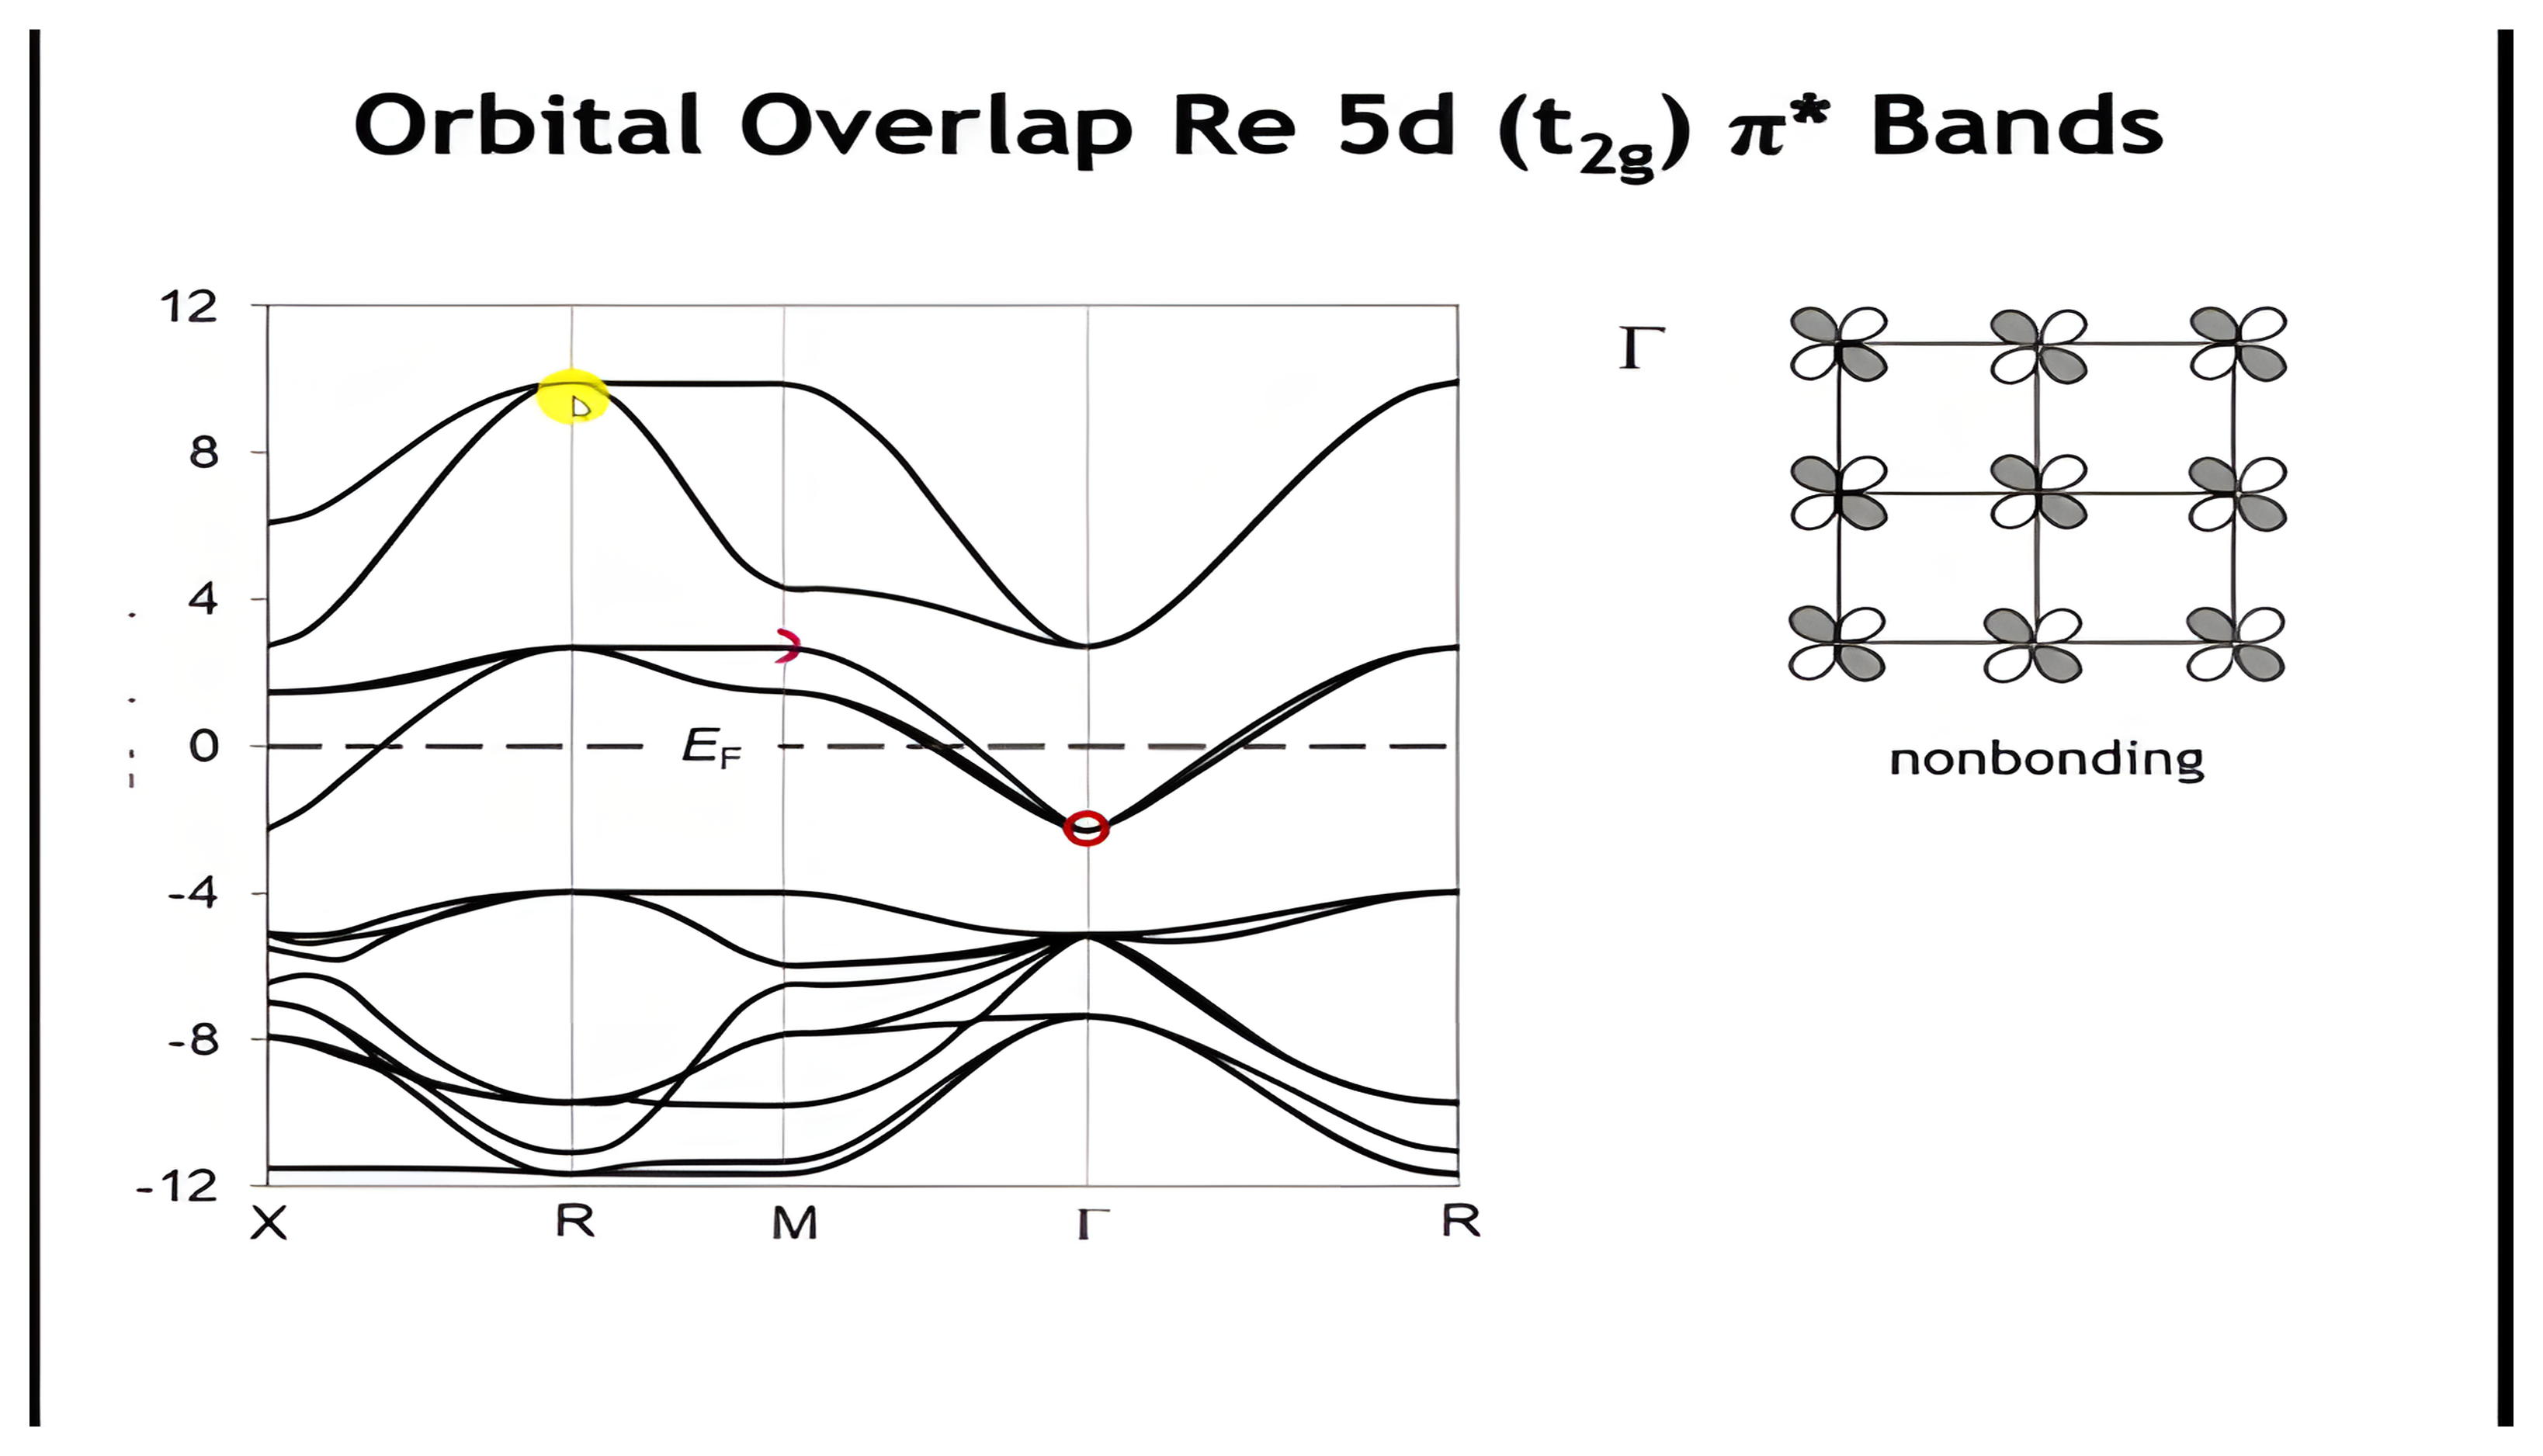
The ReO3 band structure with the t2g pi-star band marked at Gamma and its nonbonding crystal orbital drawn; a click adds the antibonding crystal orbital at the M point.

Orbital Overlap: O 2p Nonbonding Bands
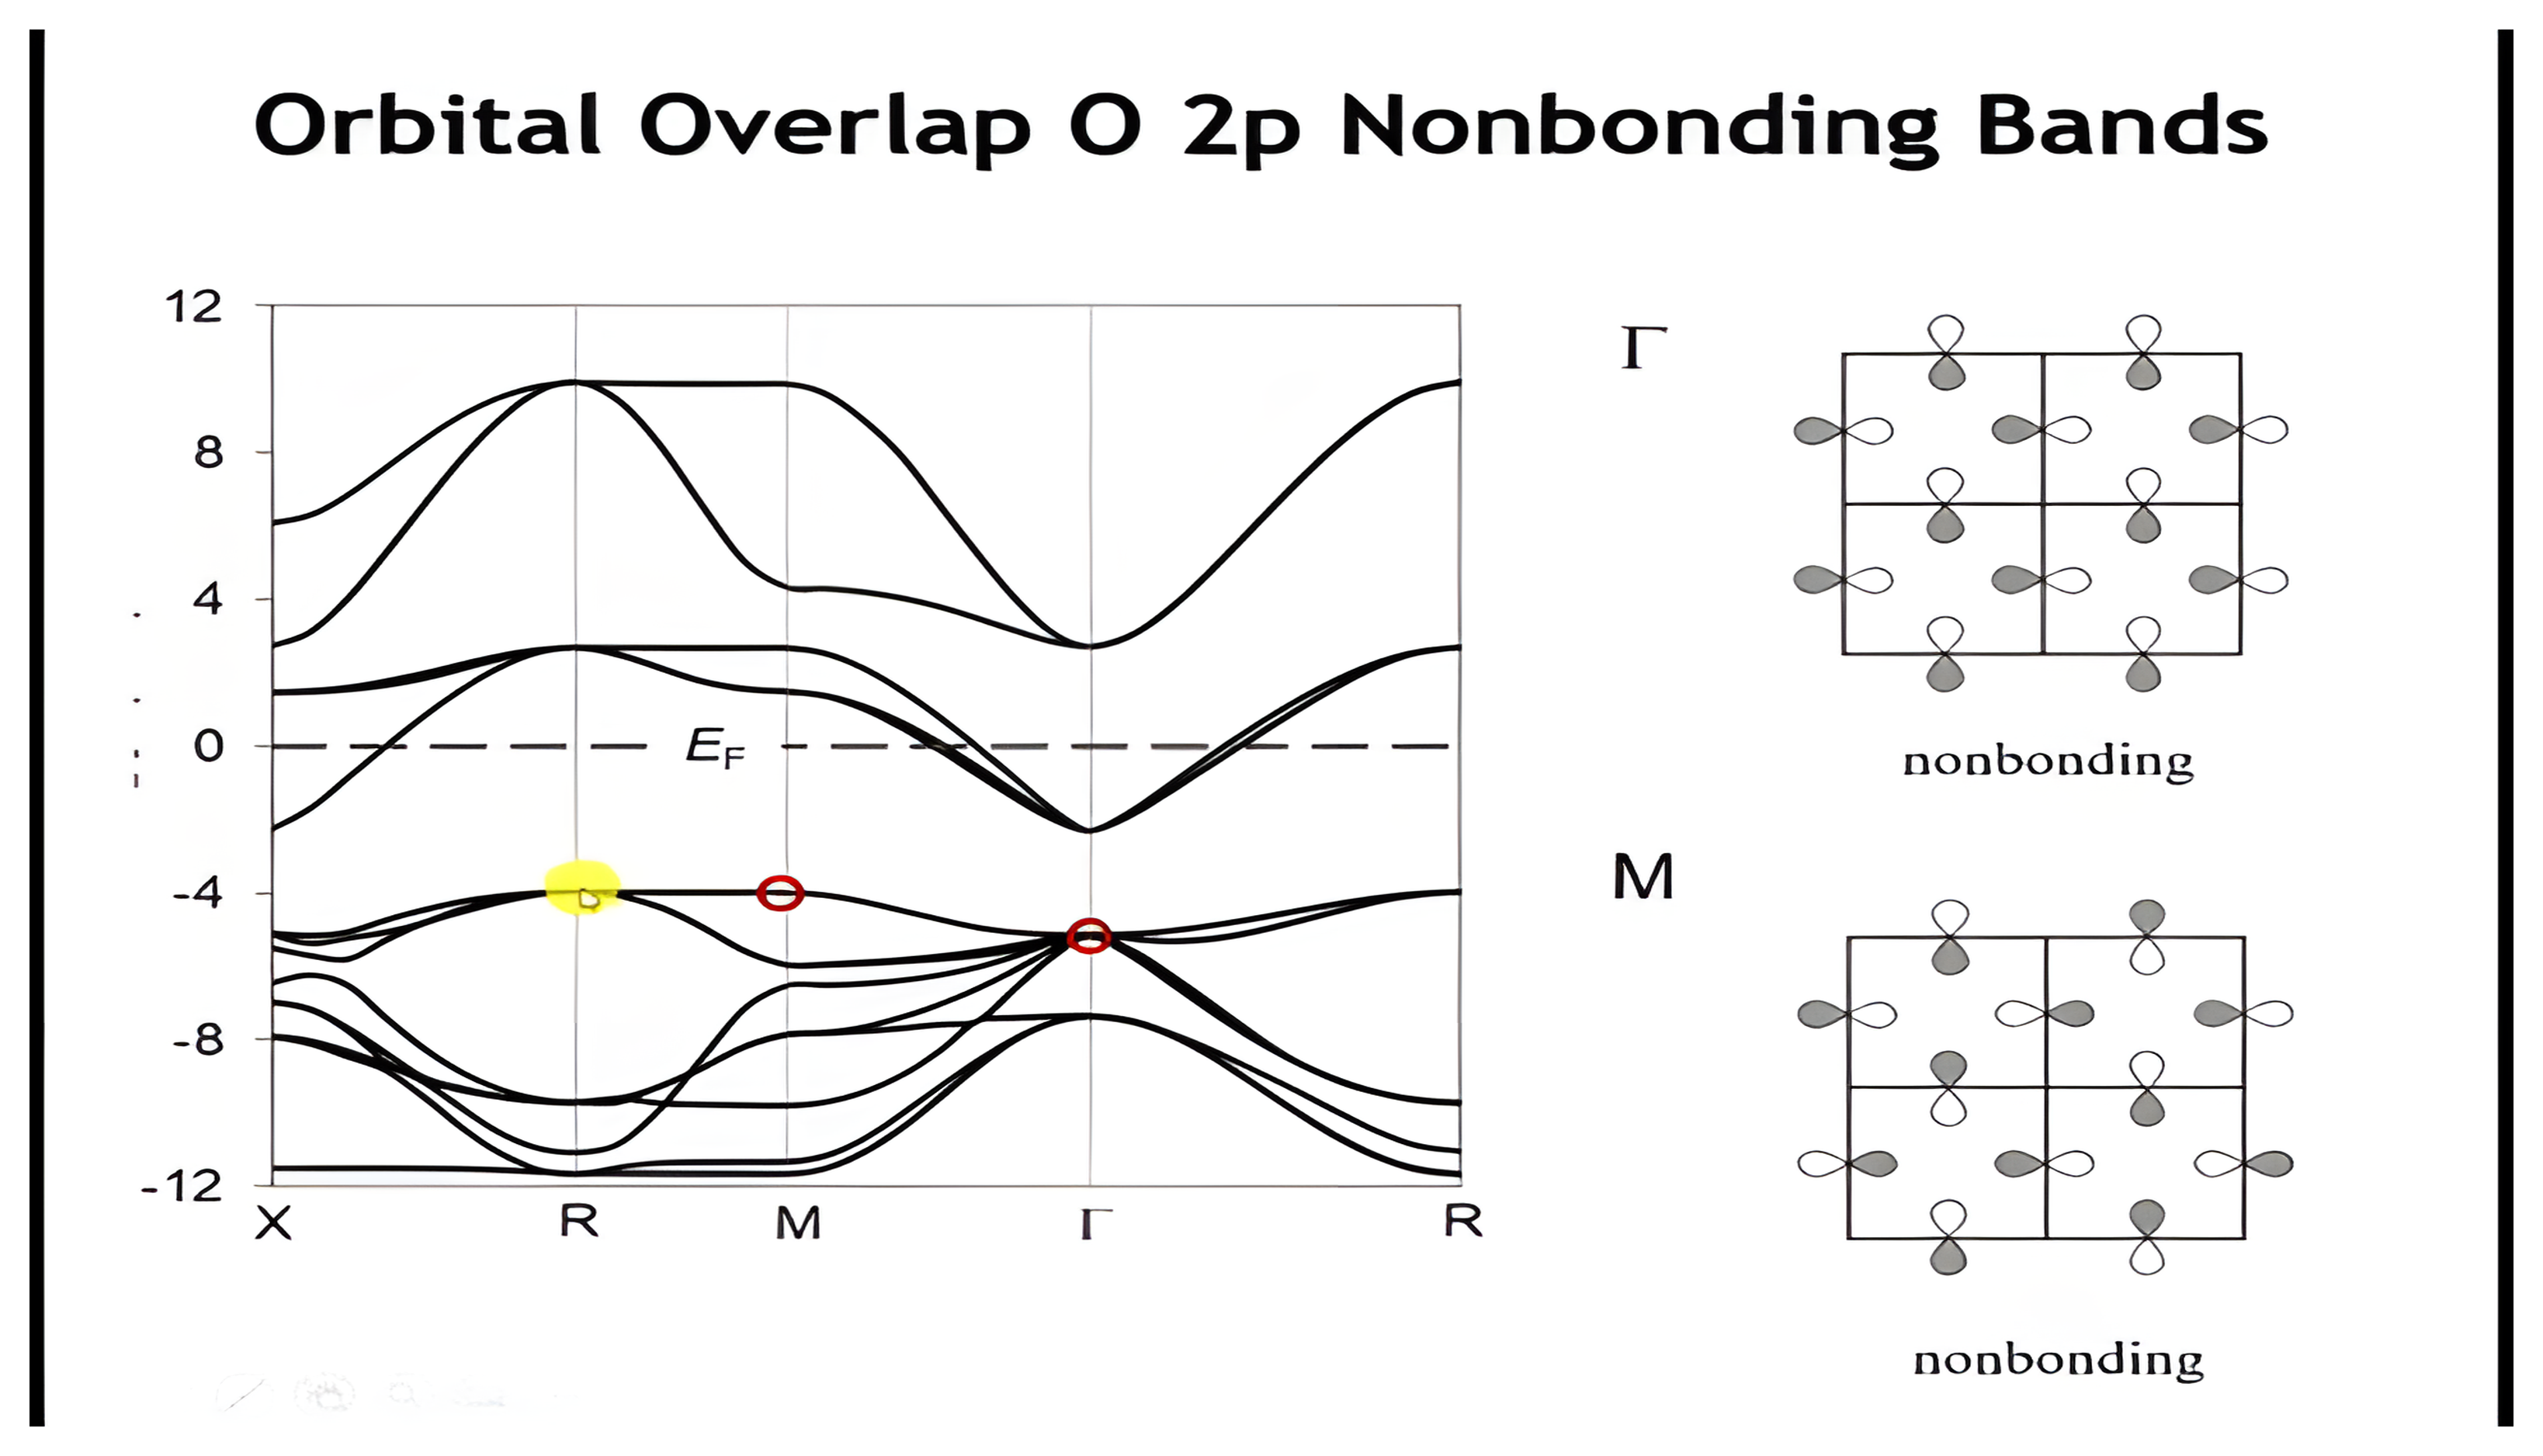
The ReO3 band structure with the highest oxygen 2p bands marked and the nonbonding oxygen crystal orbitals drawn at Gamma and at M.

ReO₃ Band Structure – Key Features

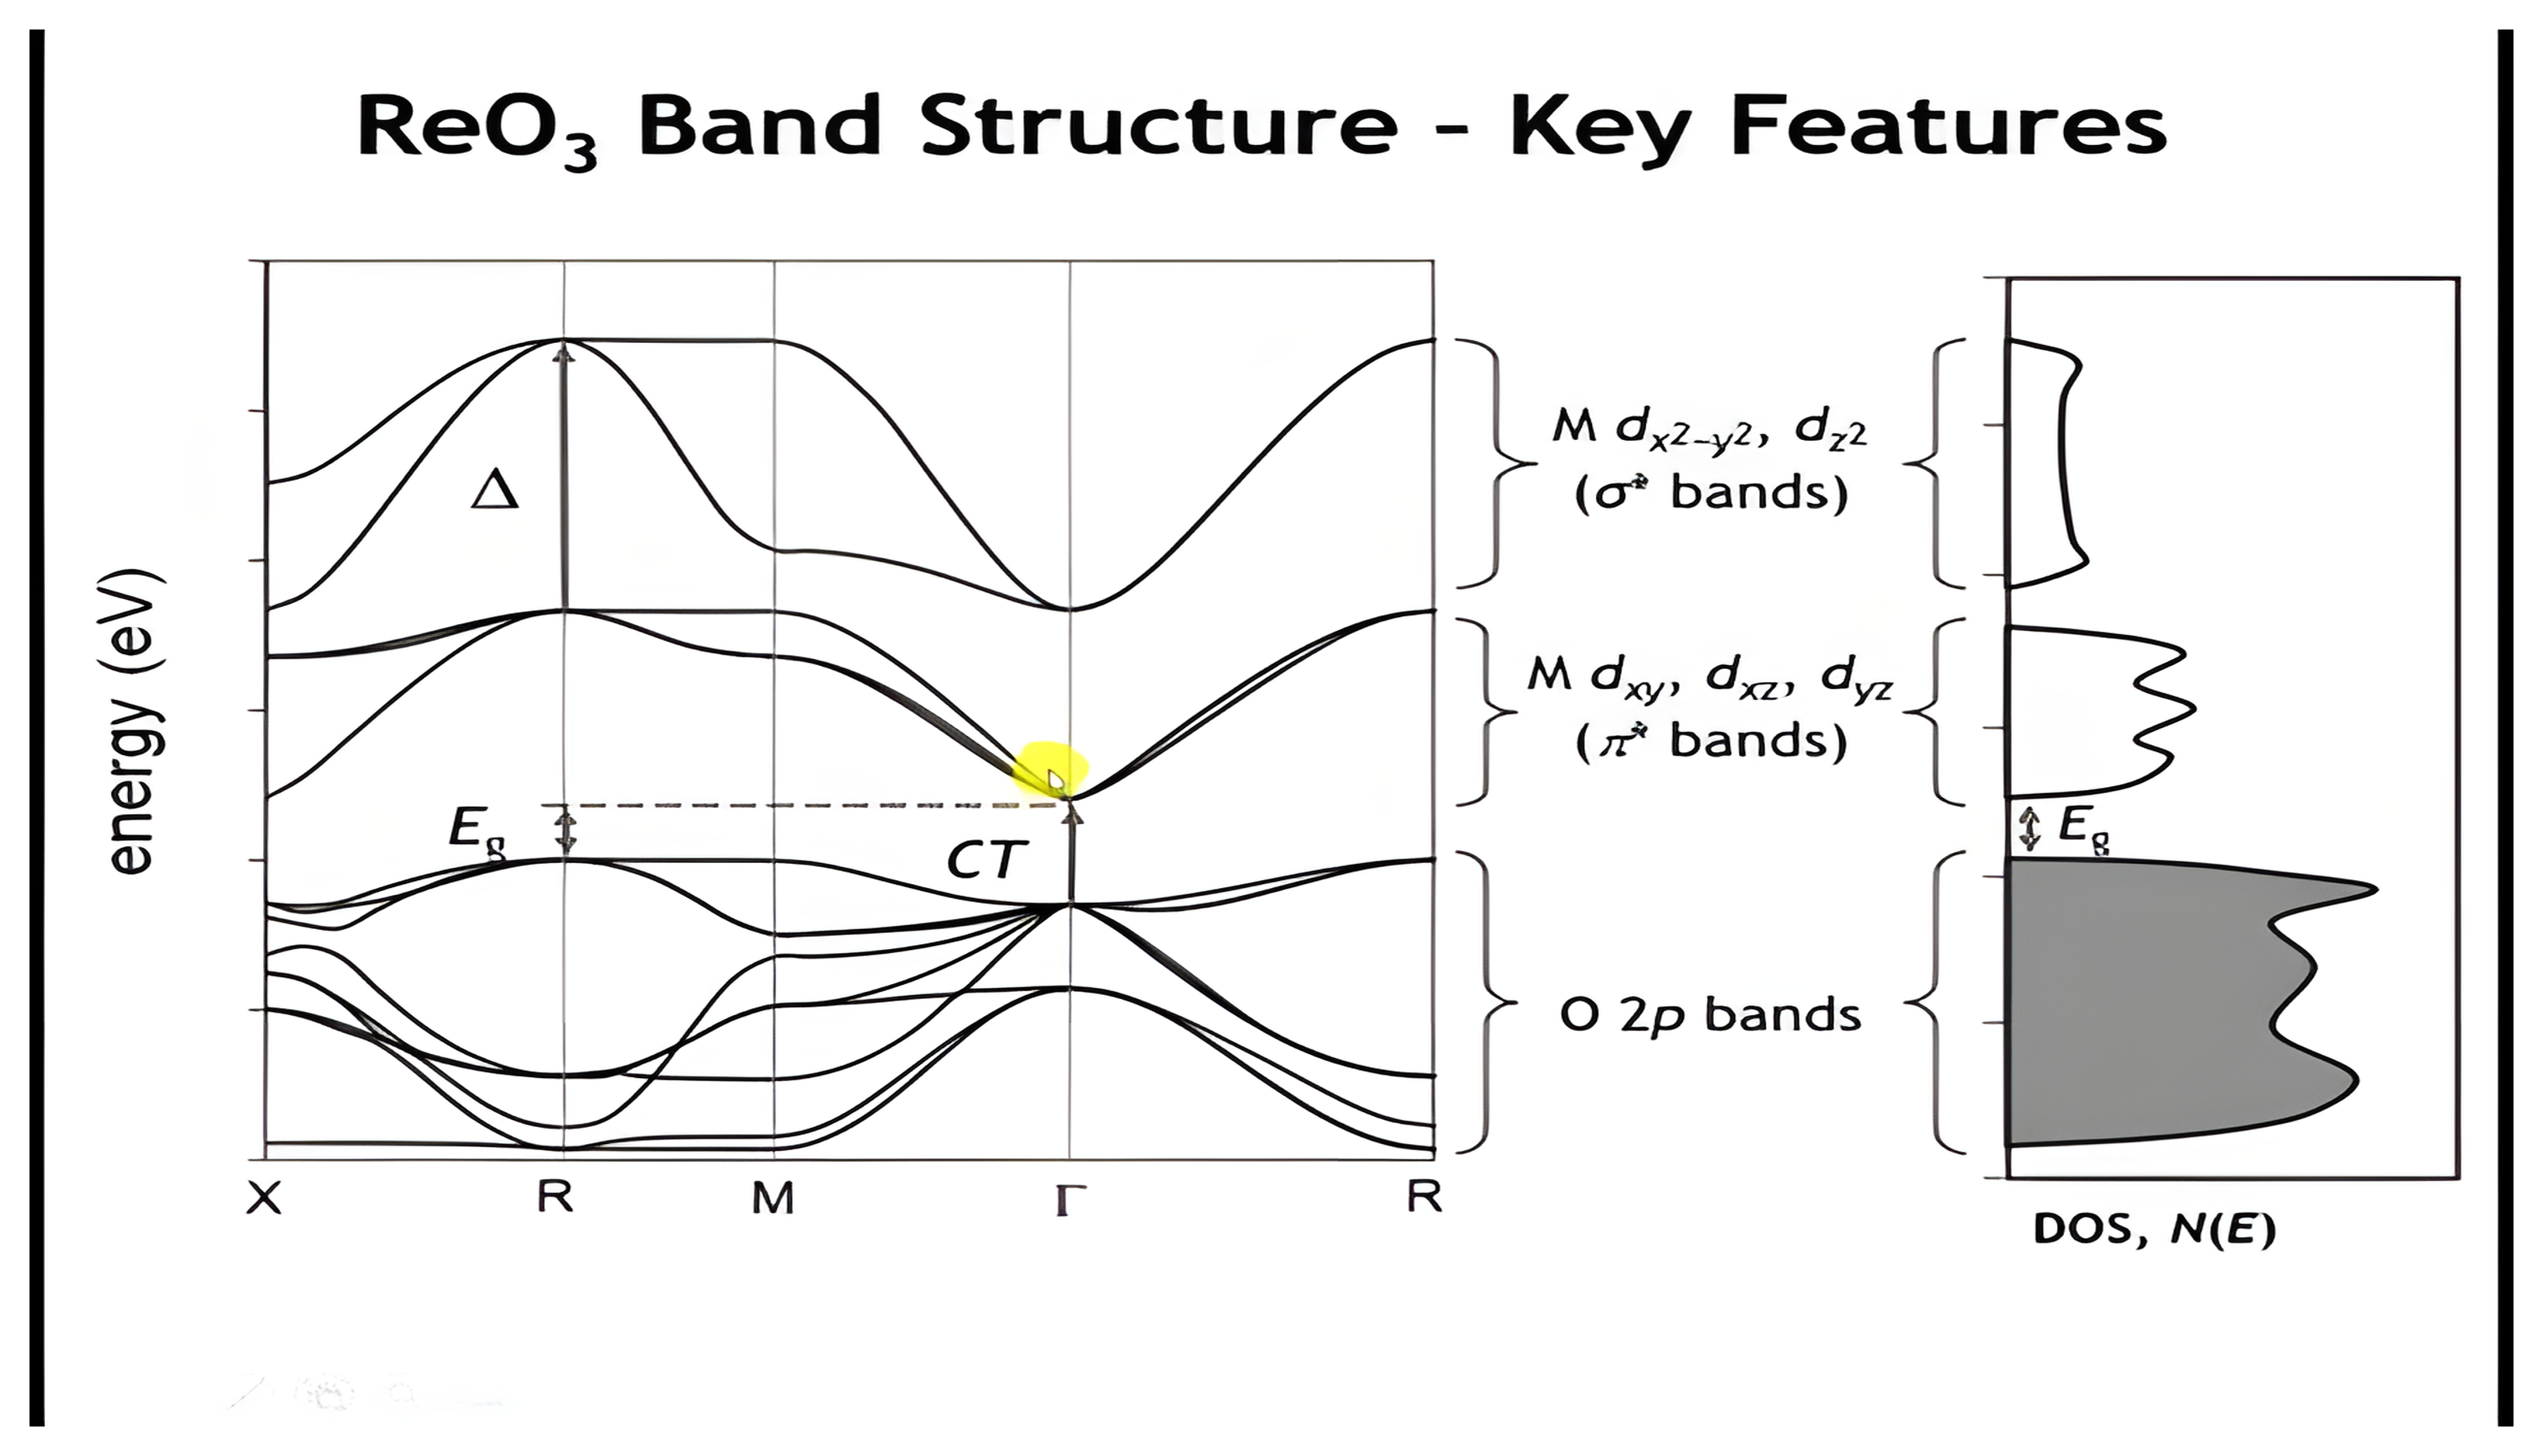
The ReO3 band structure annotated with the octahedral ligand field splitting Delta at R, the charge transfer energy CT at Gamma, and the band gap Eg between the highest O 2p state and the lowest Re 5d state, next to the density of states.

Periodic Trends: Across the Period

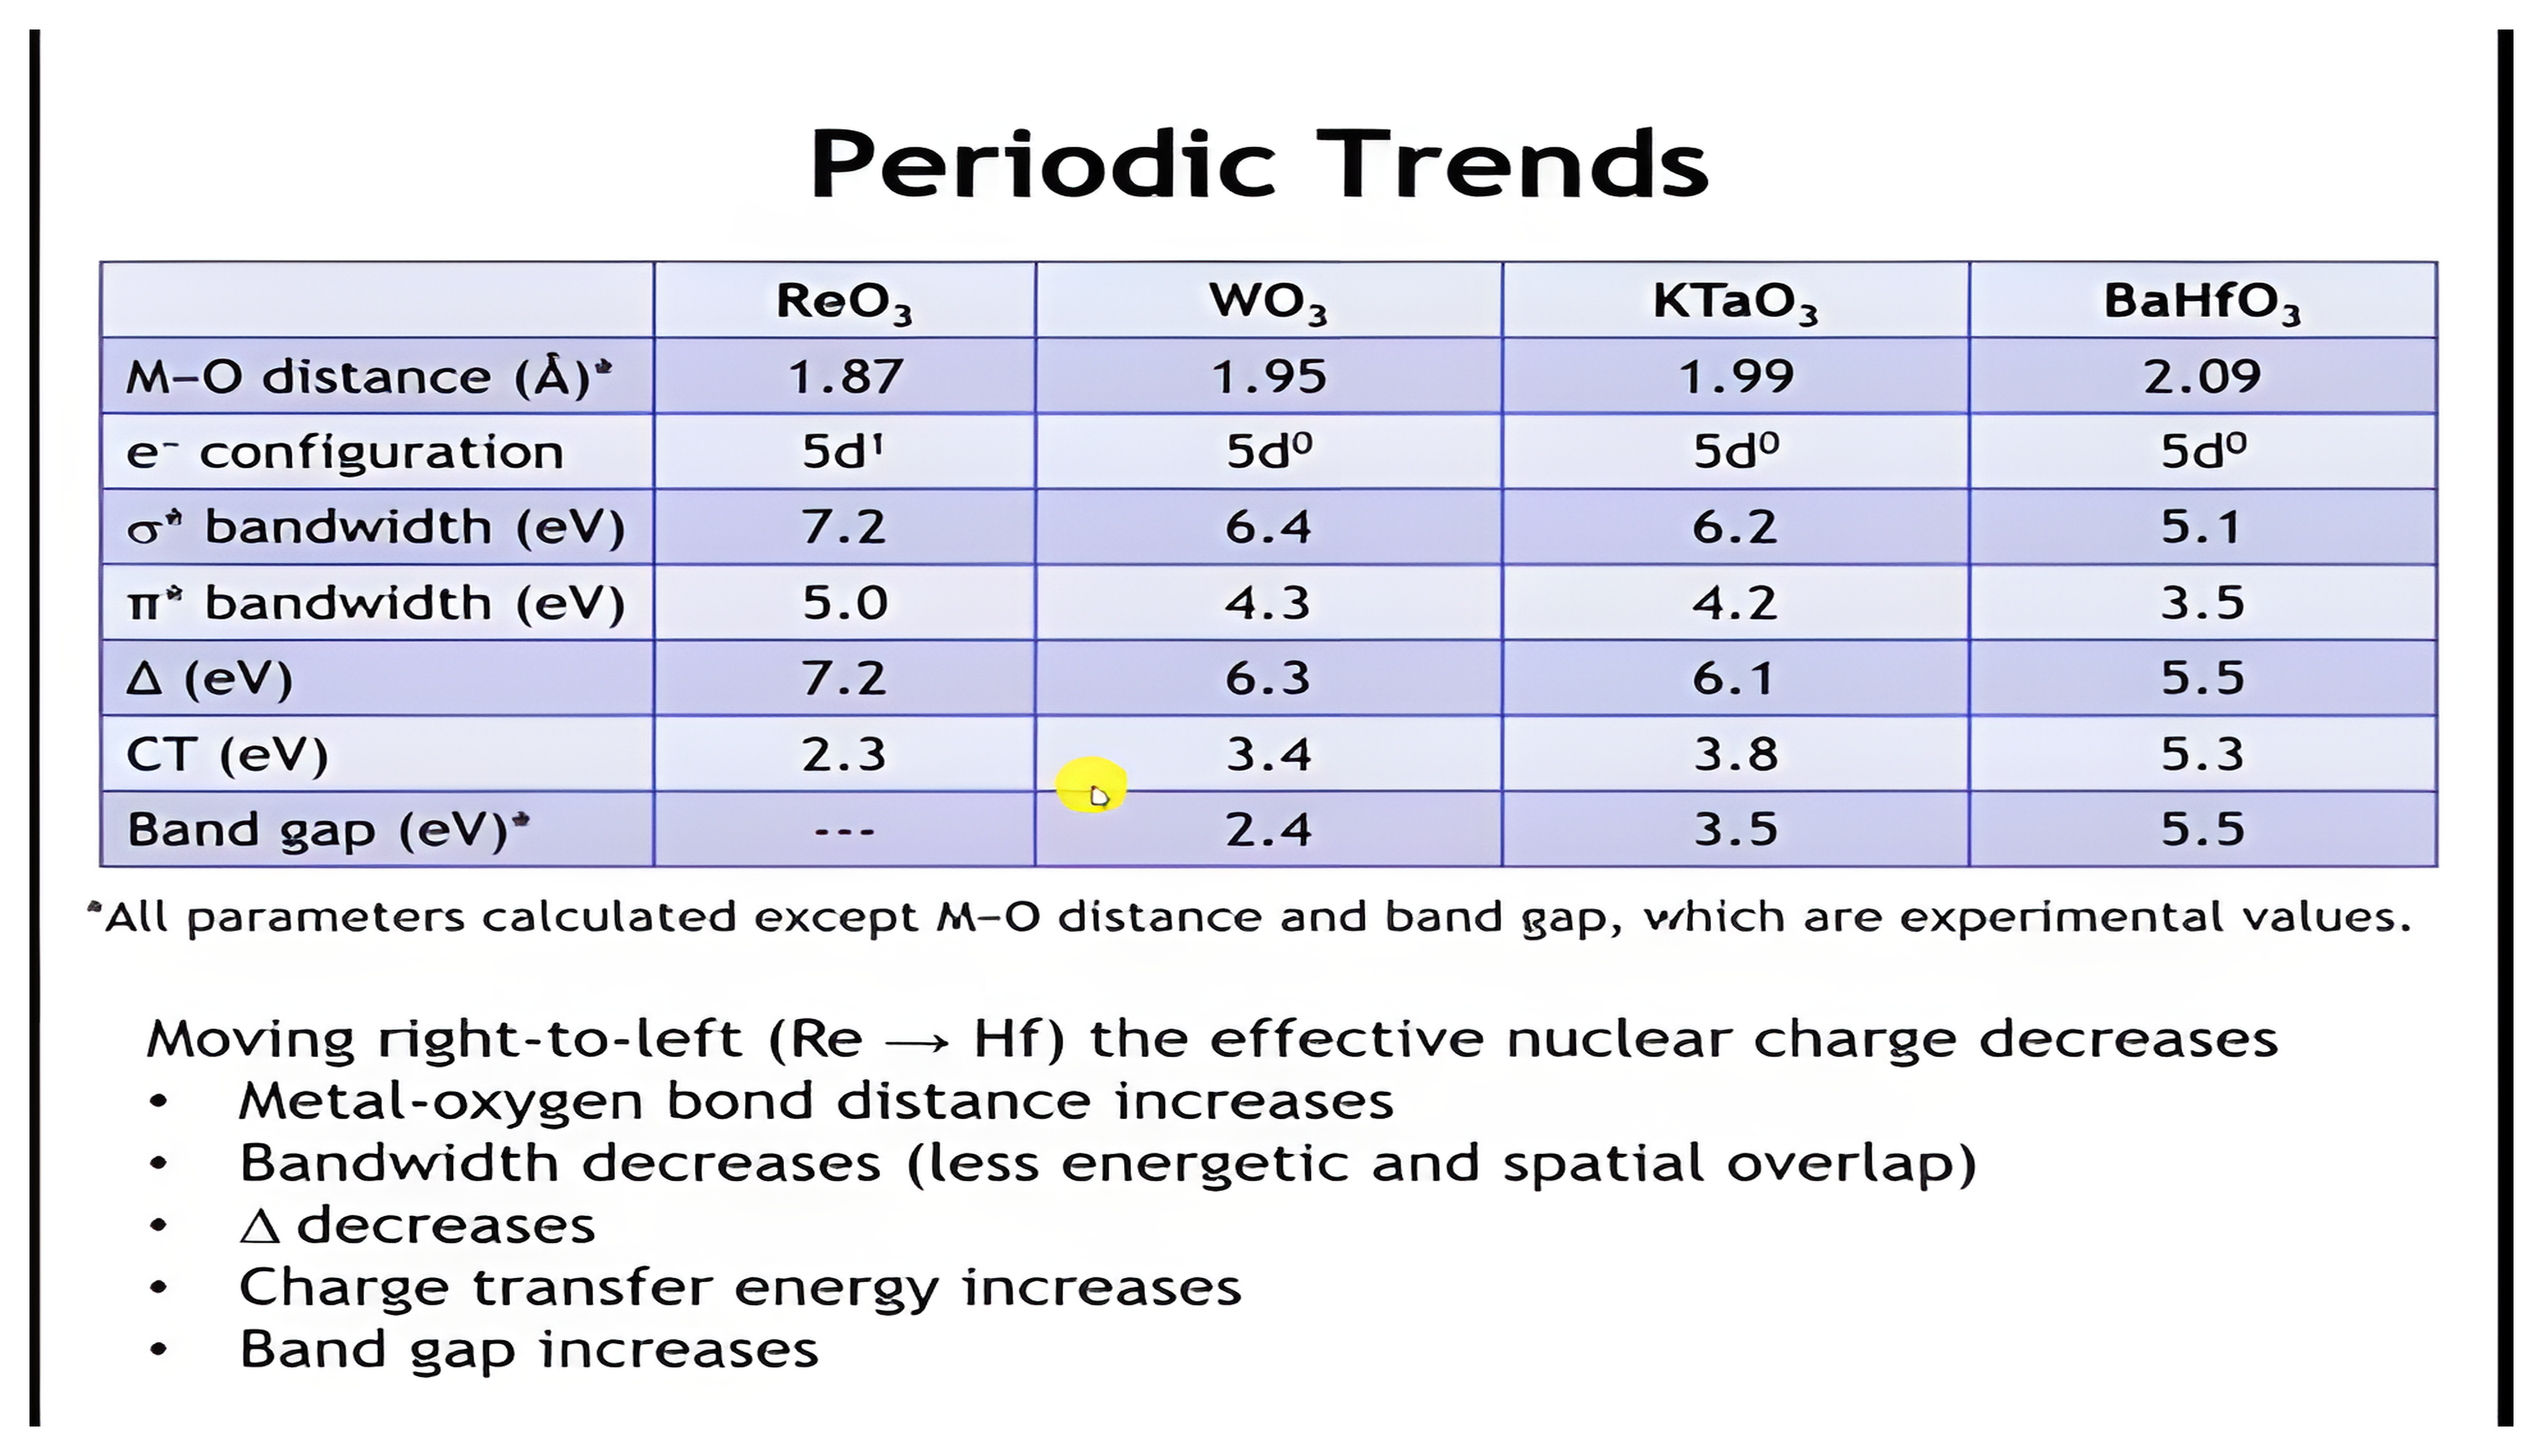
A table comparing ReO3, WO3, KTaO3, and BaHfO3: metal-oxygen distance, electron configuration, sigma-star and pi-star bandwidths, ligand field splitting, charge transfer energy, and band gap; moving from Re to Hf the bandwidths and splitting decrease while charge transfer energy and band gap increase.

The Periodic Table

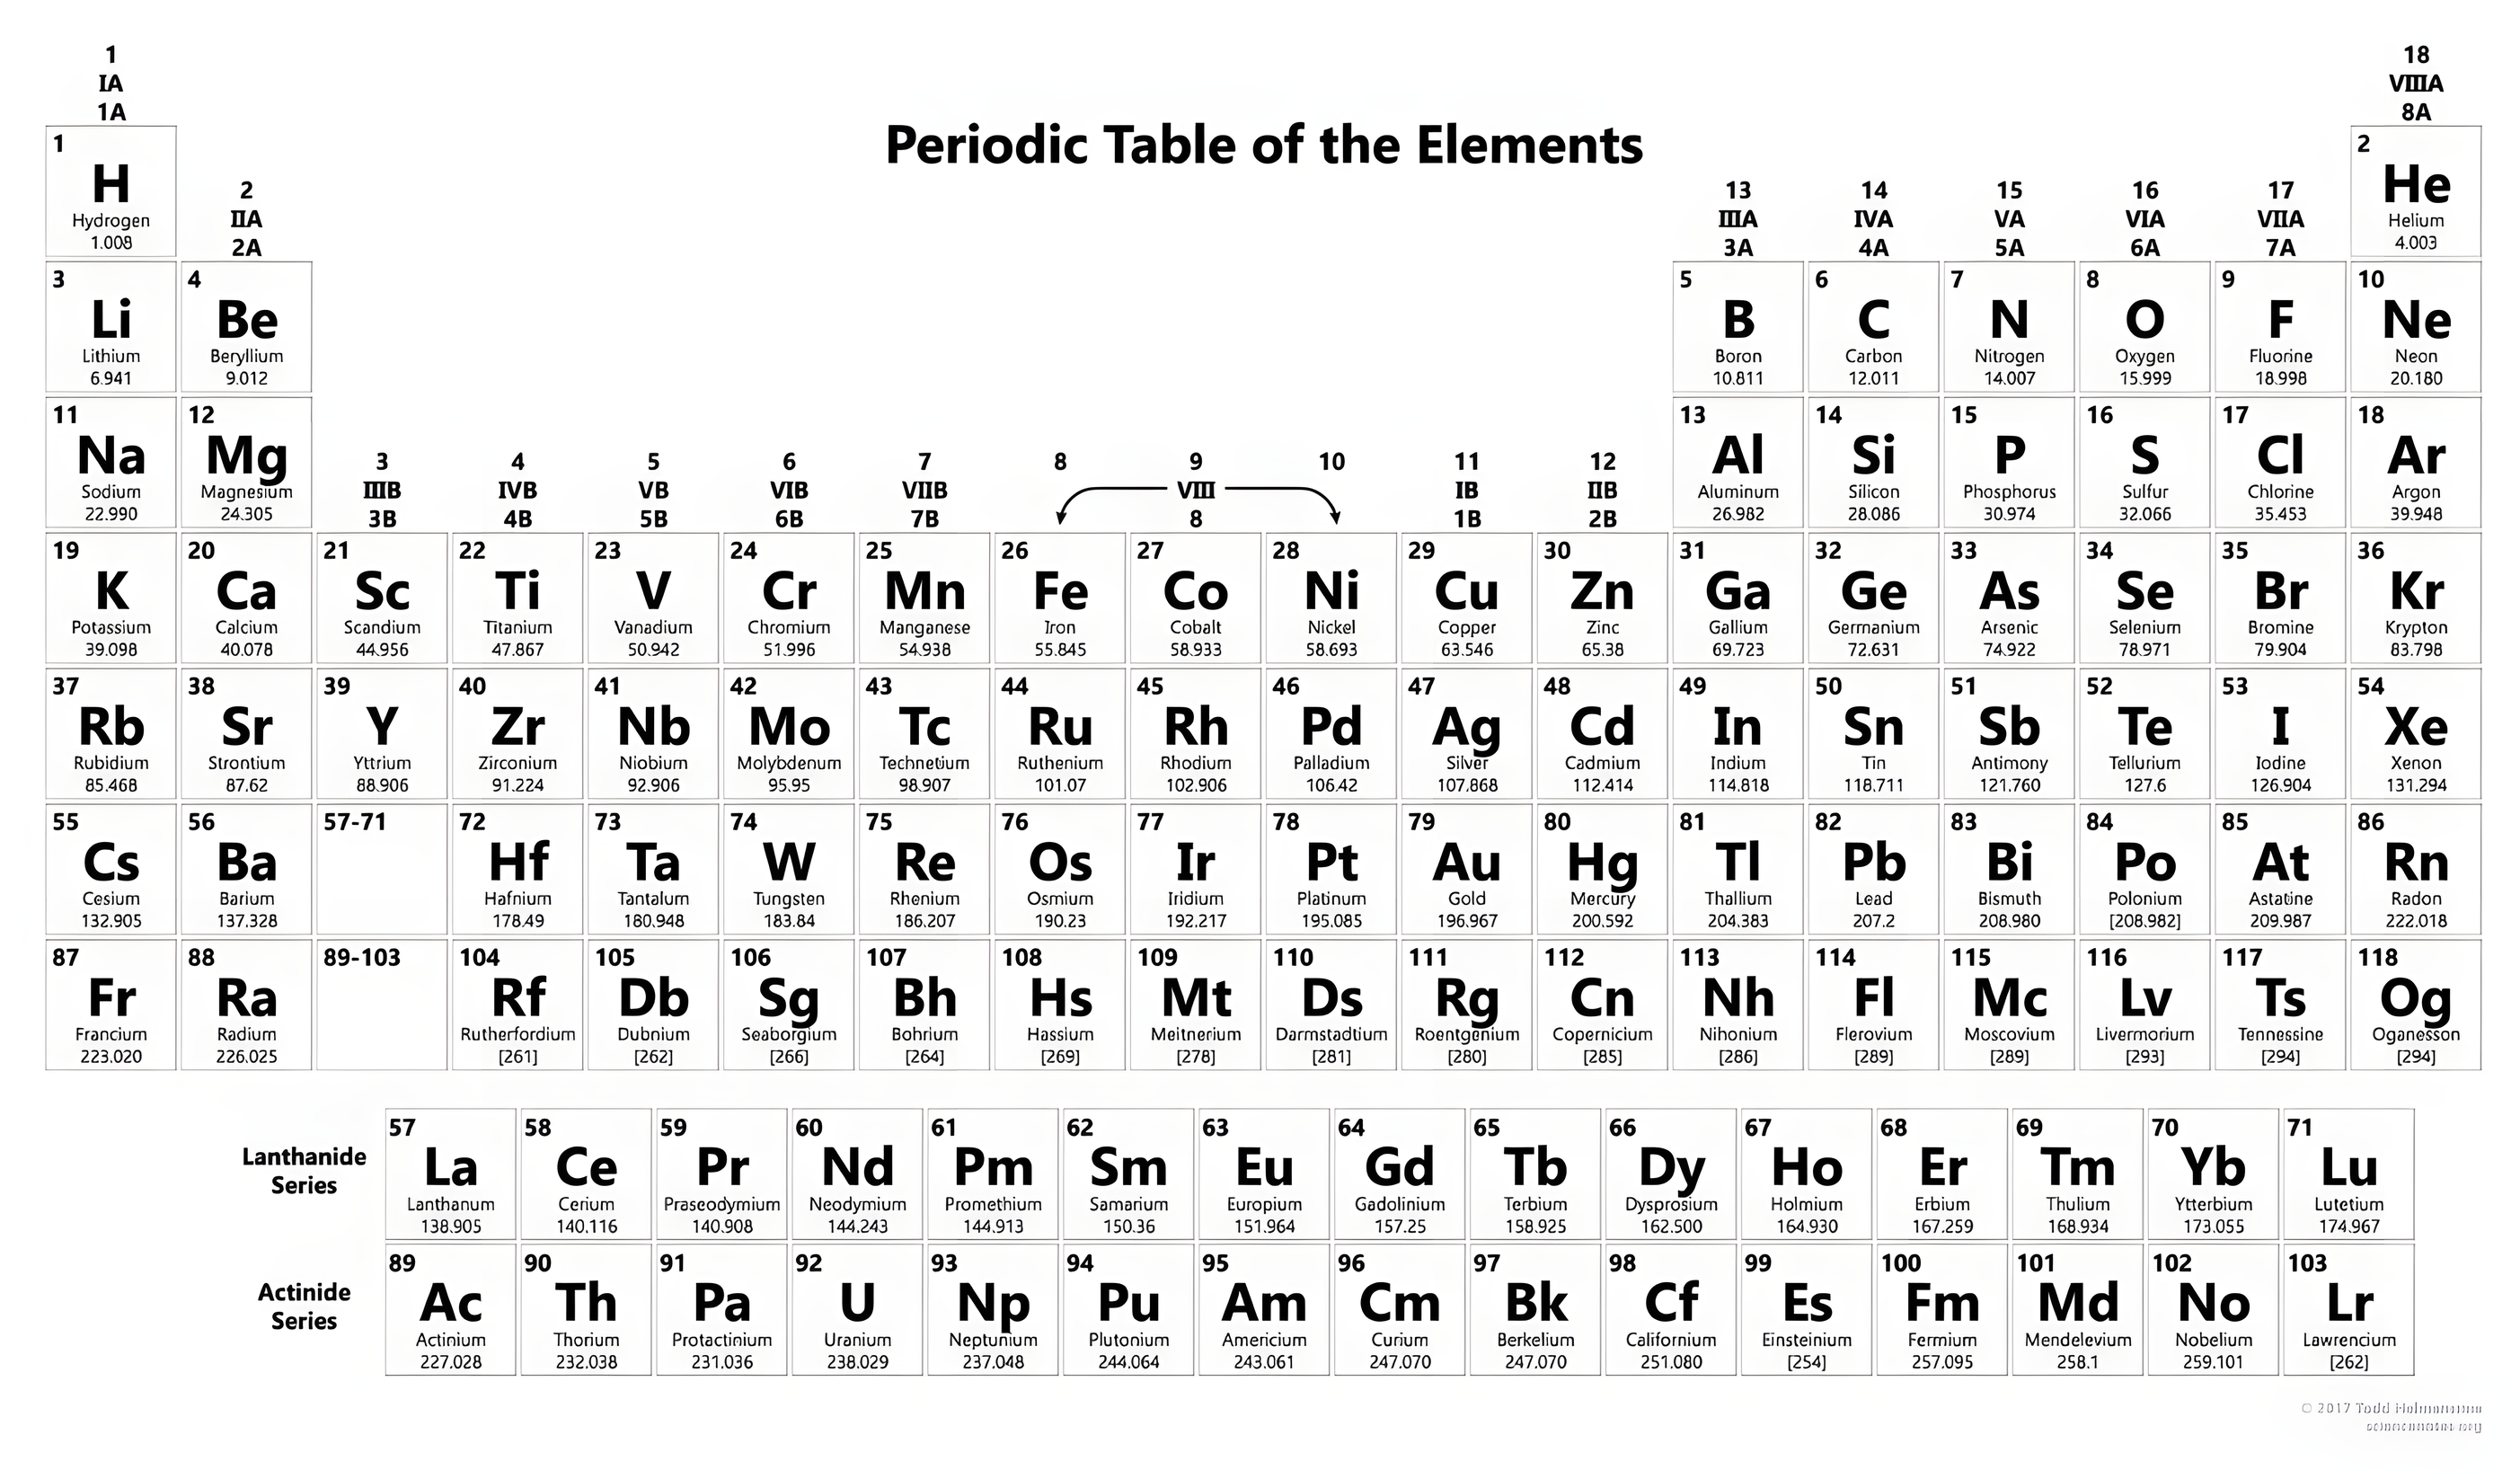
A periodic table of the elements.

Periodic Trends: Down a Group

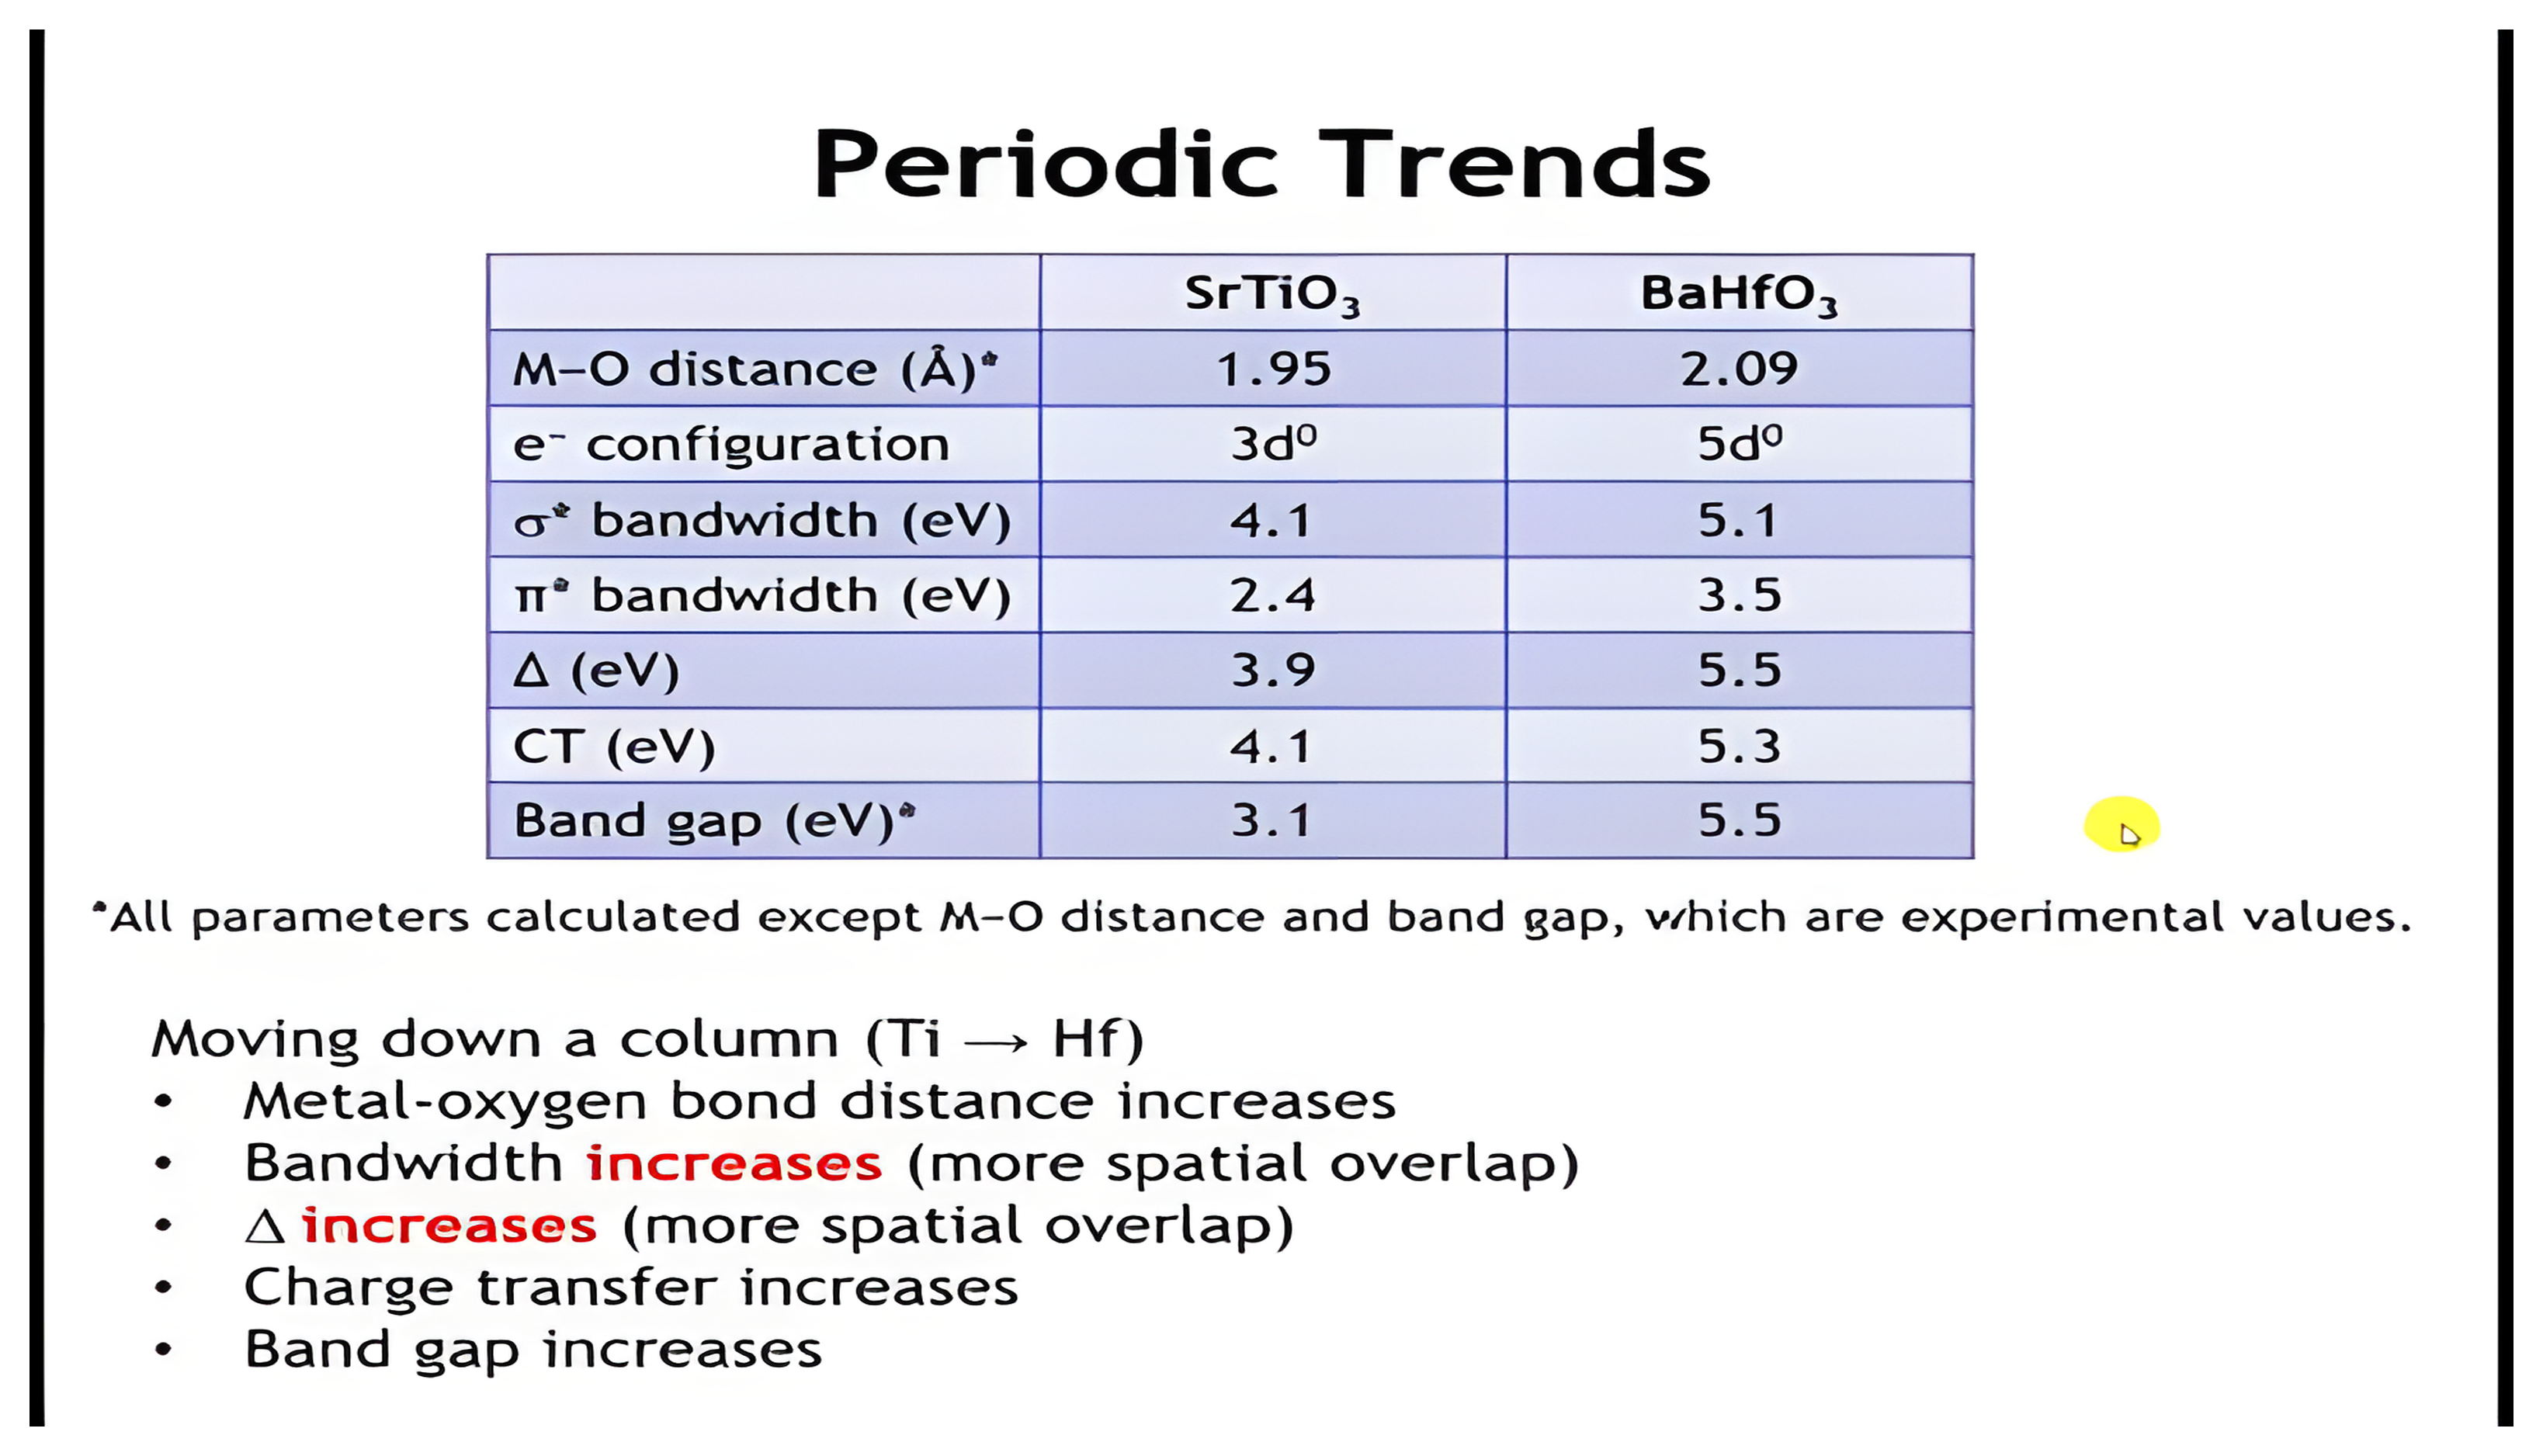
A table comparing SrTiO3 and BaHfO3: moving down the column from Ti to Hf the metal-oxygen distance, bandwidths, ligand field splitting, charge transfer energy, and band gap all increase, with the bandwidth and splitting increases highlighted in red.

Check Your Understanding: Counting Bands
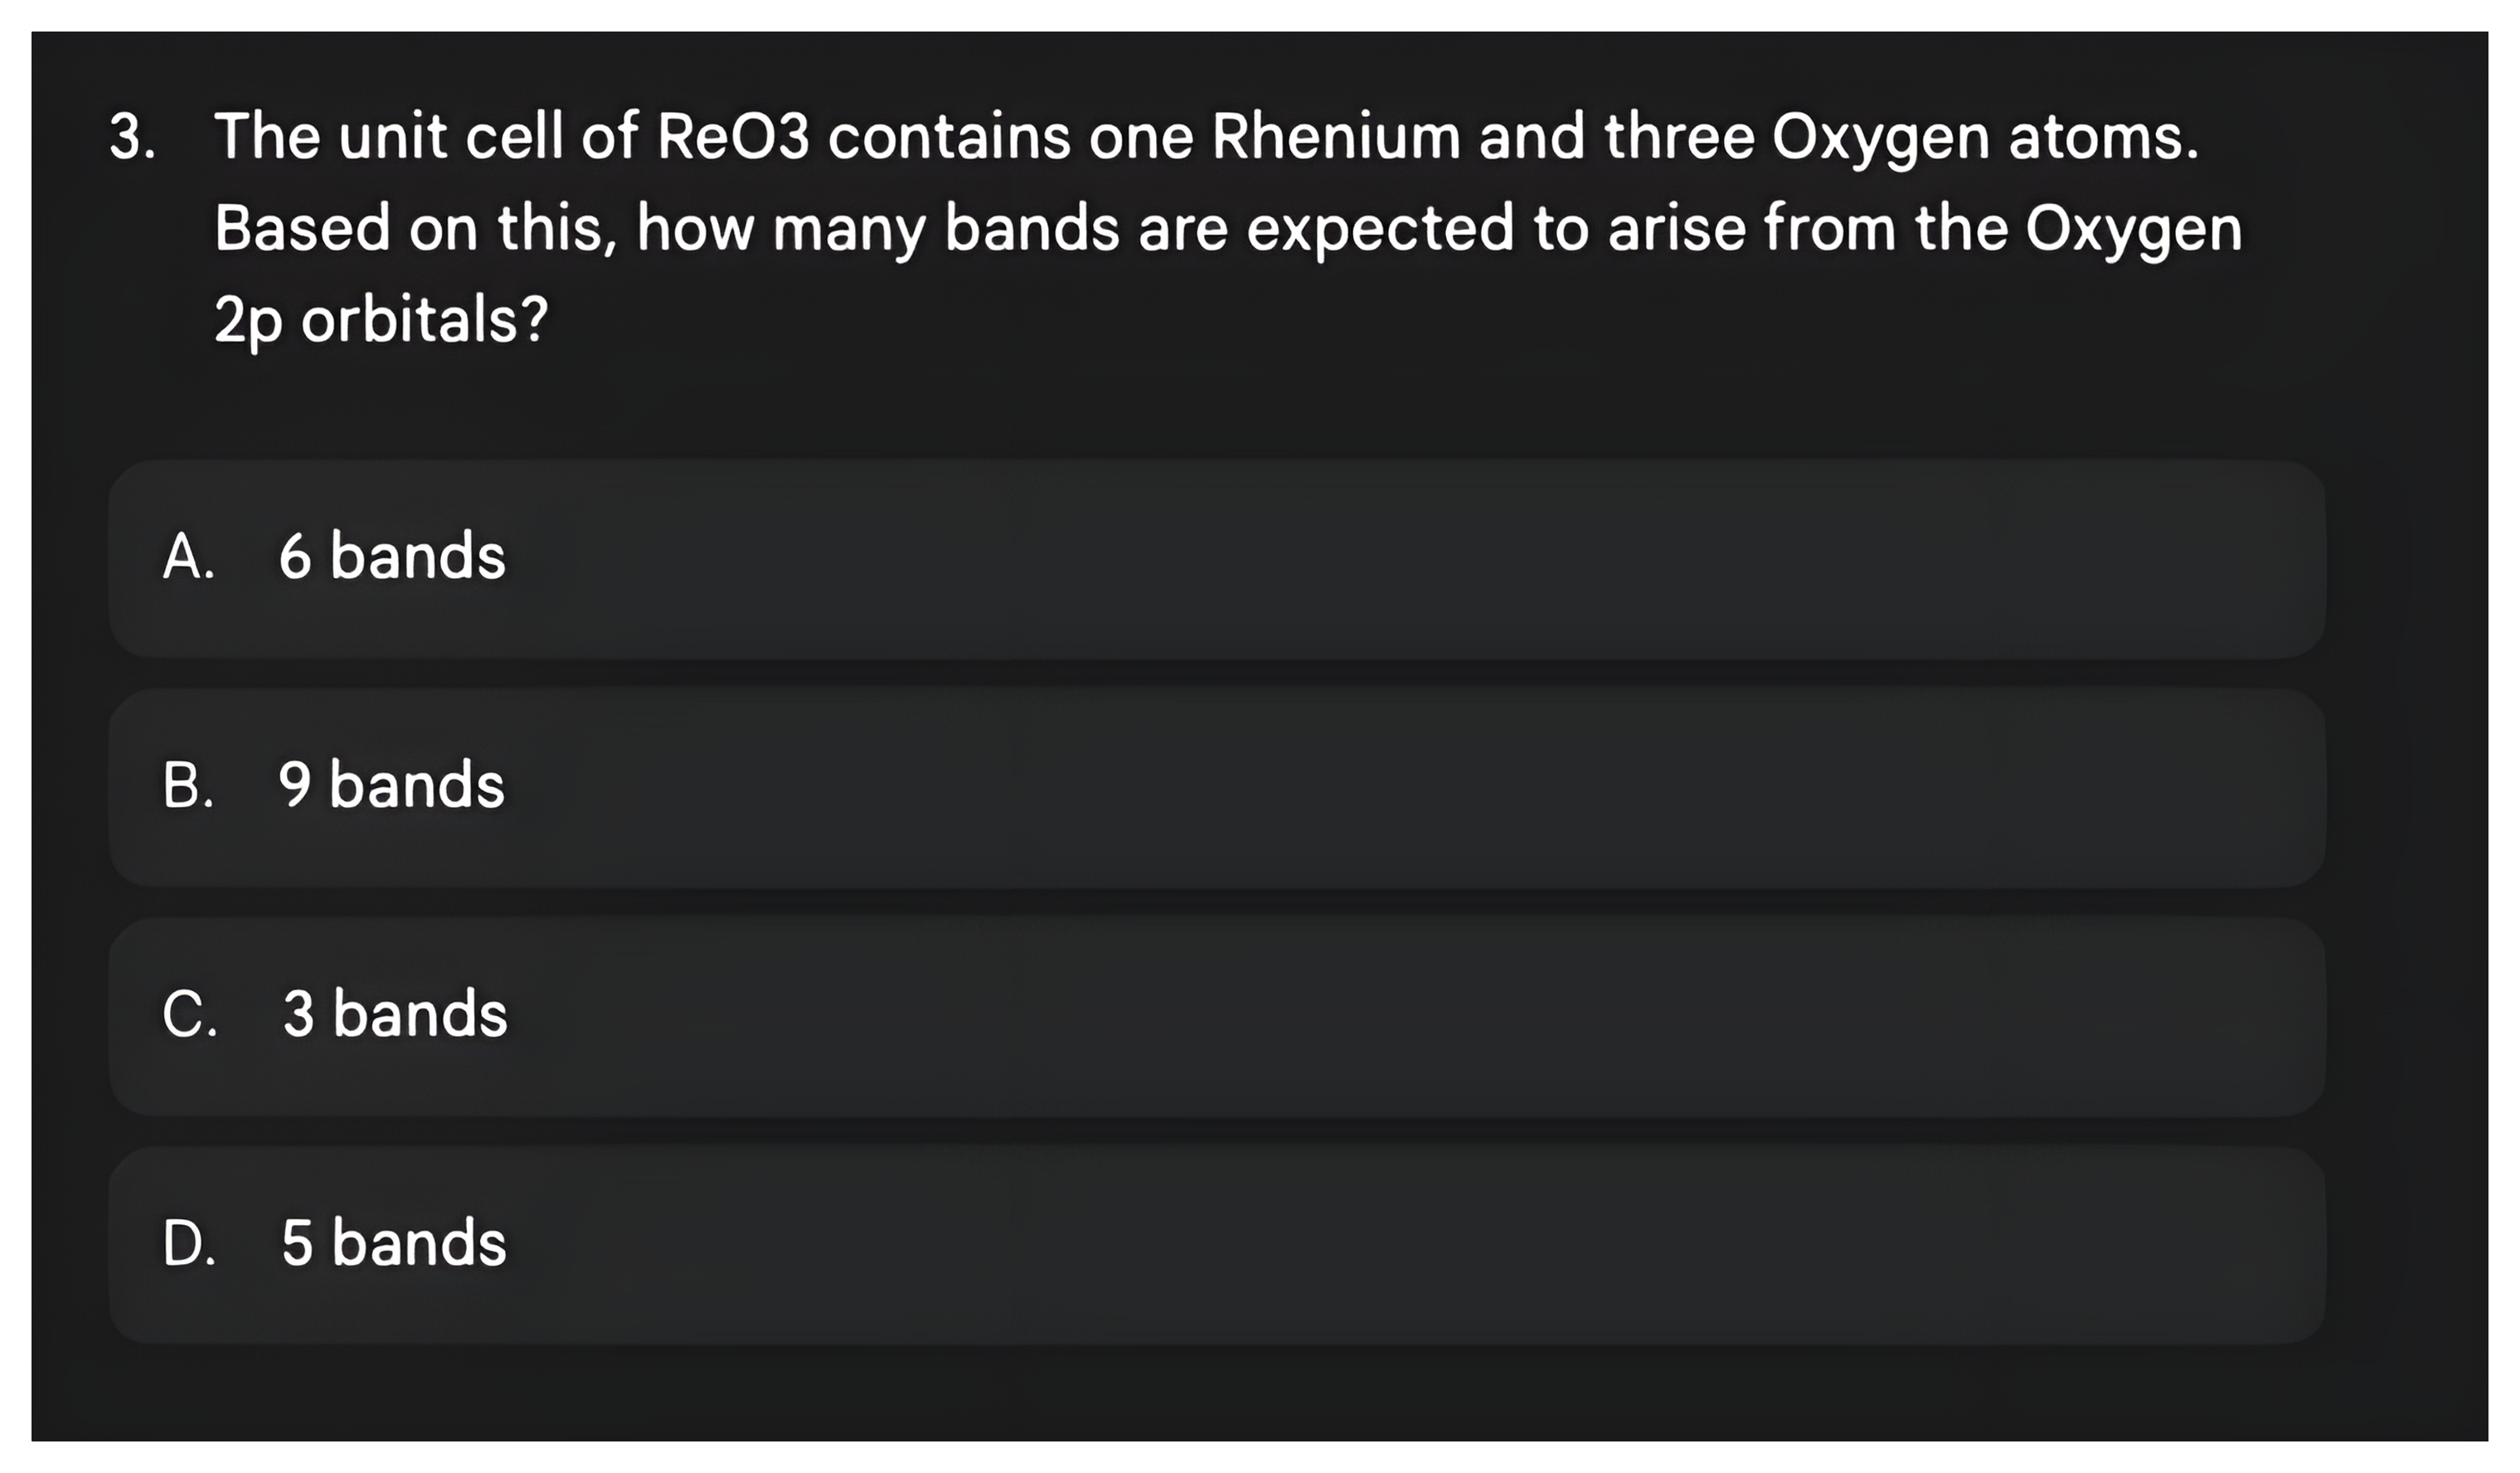
Question 3 asking how many bands arise from the oxygen 2p orbitals in the ReO3 unit cell, then its answer: nine bands, three oxygens times three p orbitals.

Check Your Understanding: t2g Character at Γ
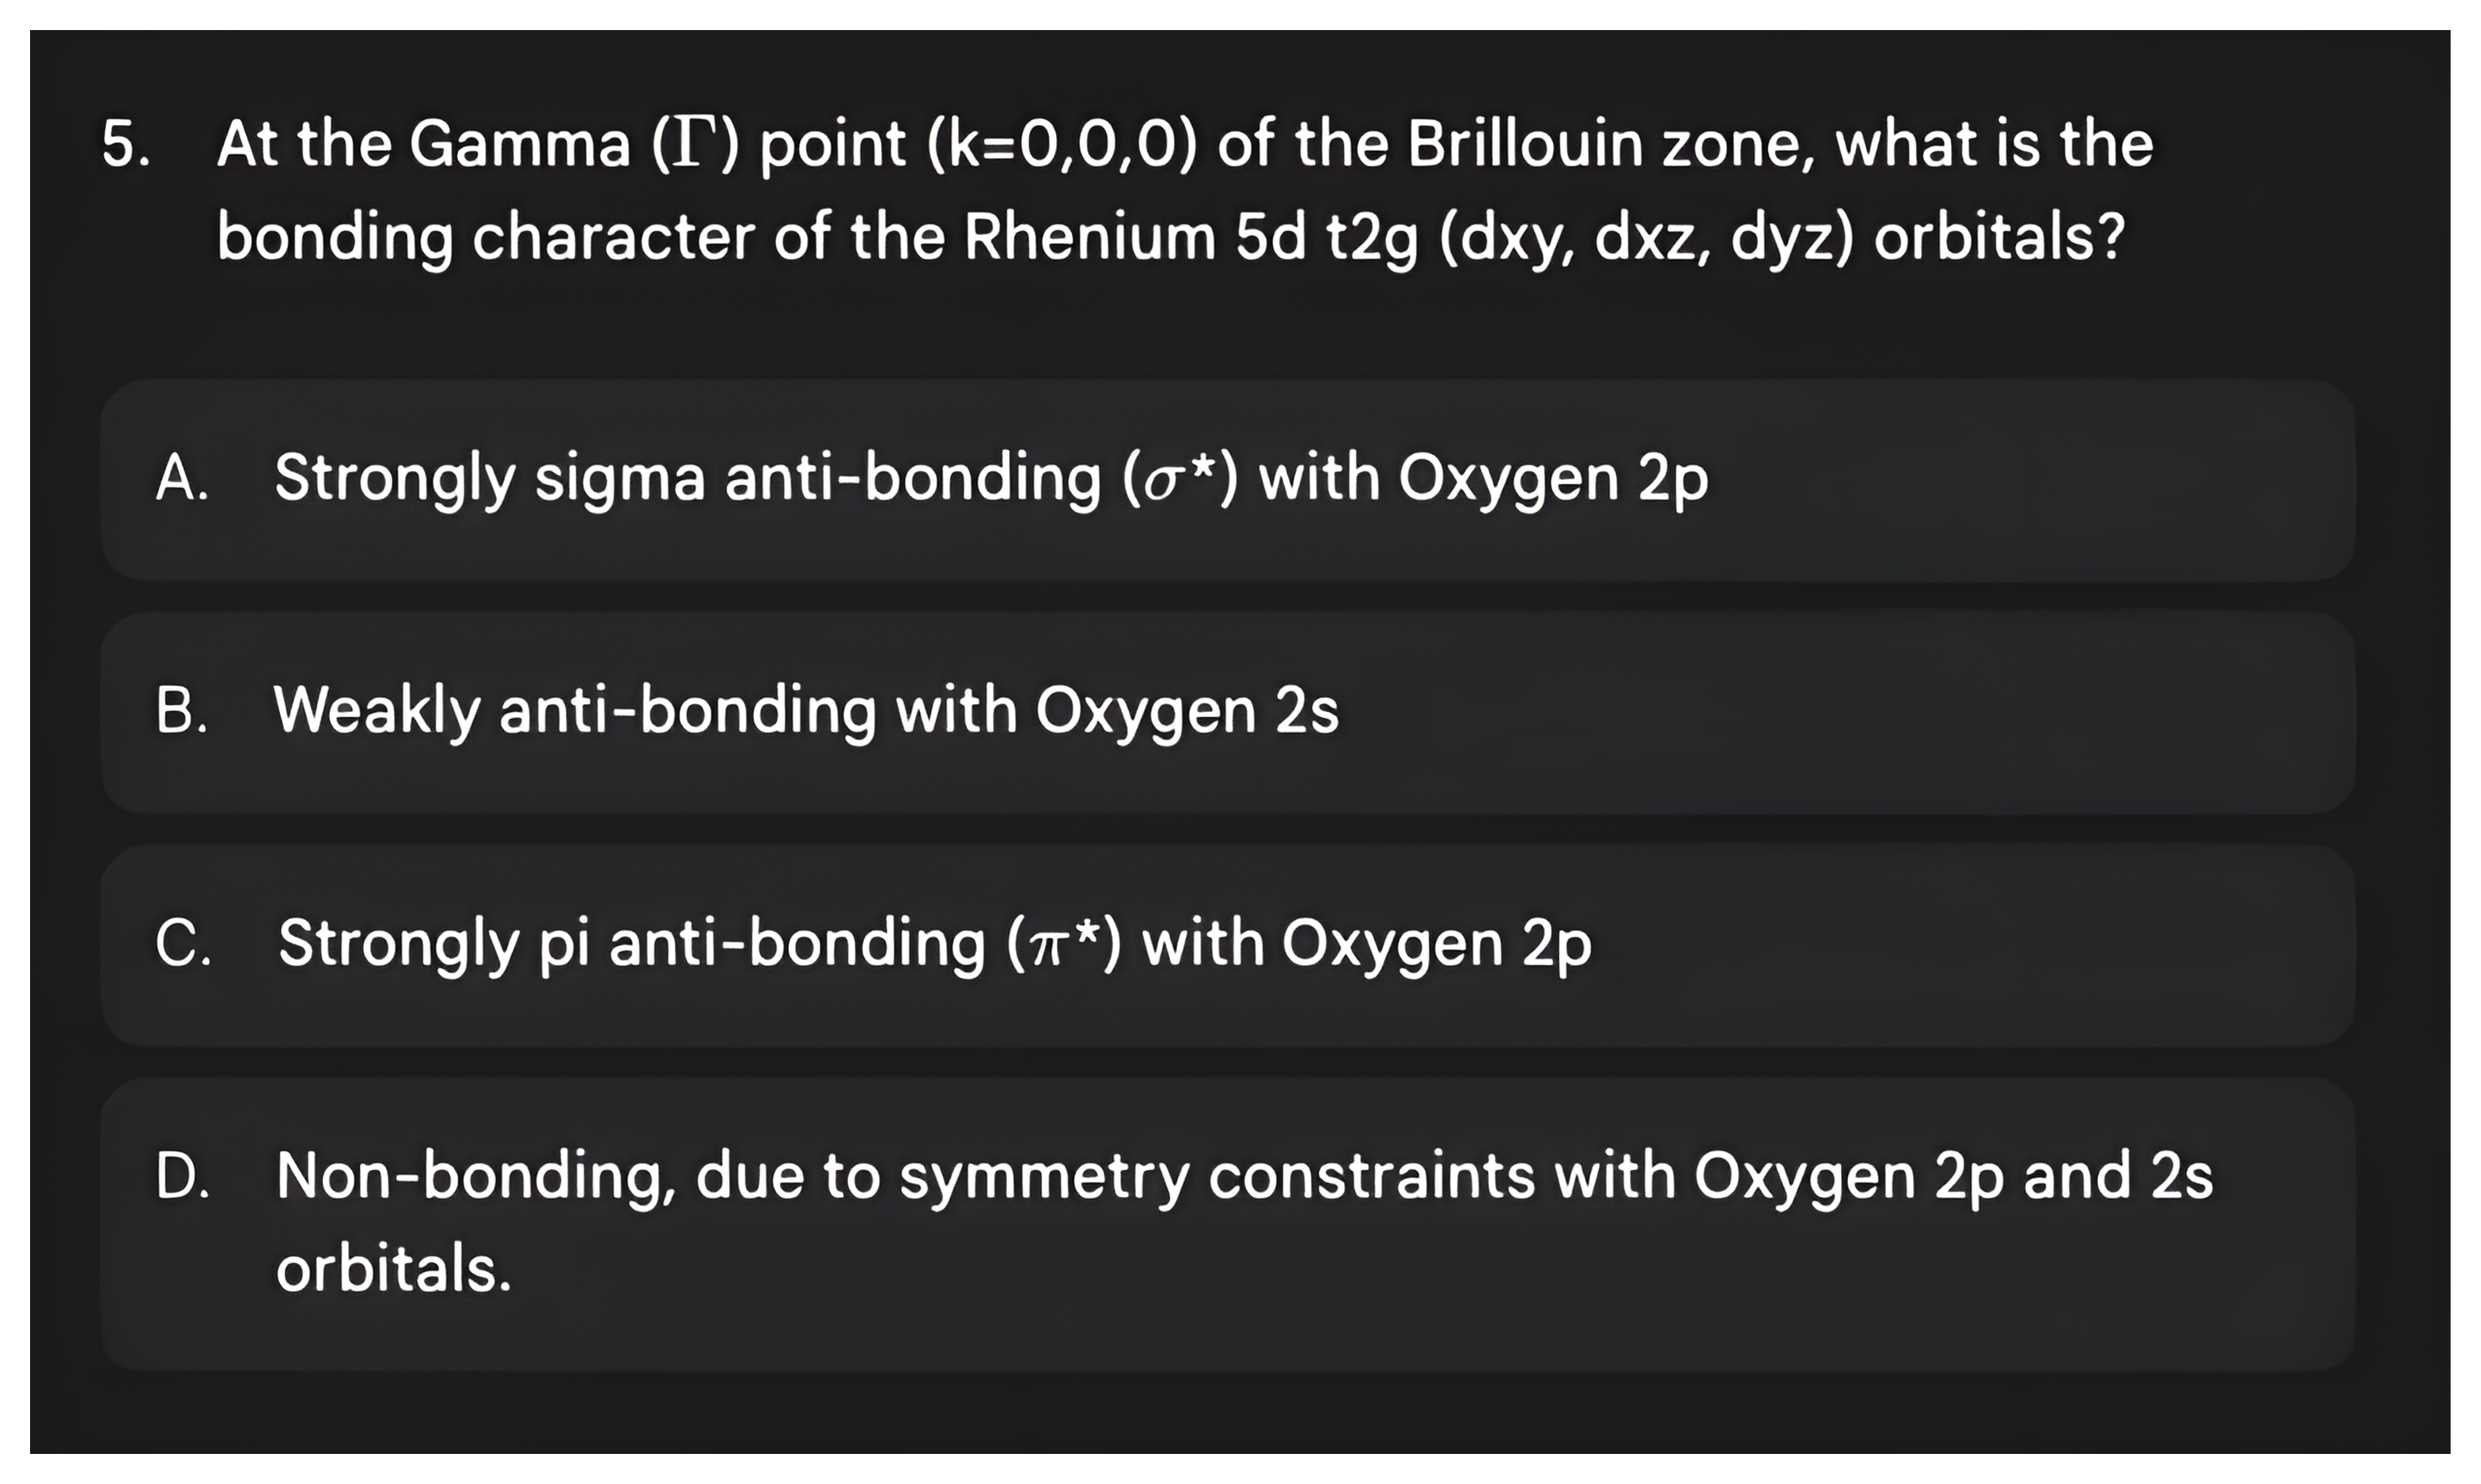
Question 5 asking for the bonding character of the rhenium 5d t2g orbitals at the Gamma point, then its answer: non-bonding, due to symmetry constraints with the oxygen 2p and 2s orbitals.

Check Your Understanding: The σ* Band from Γ to M
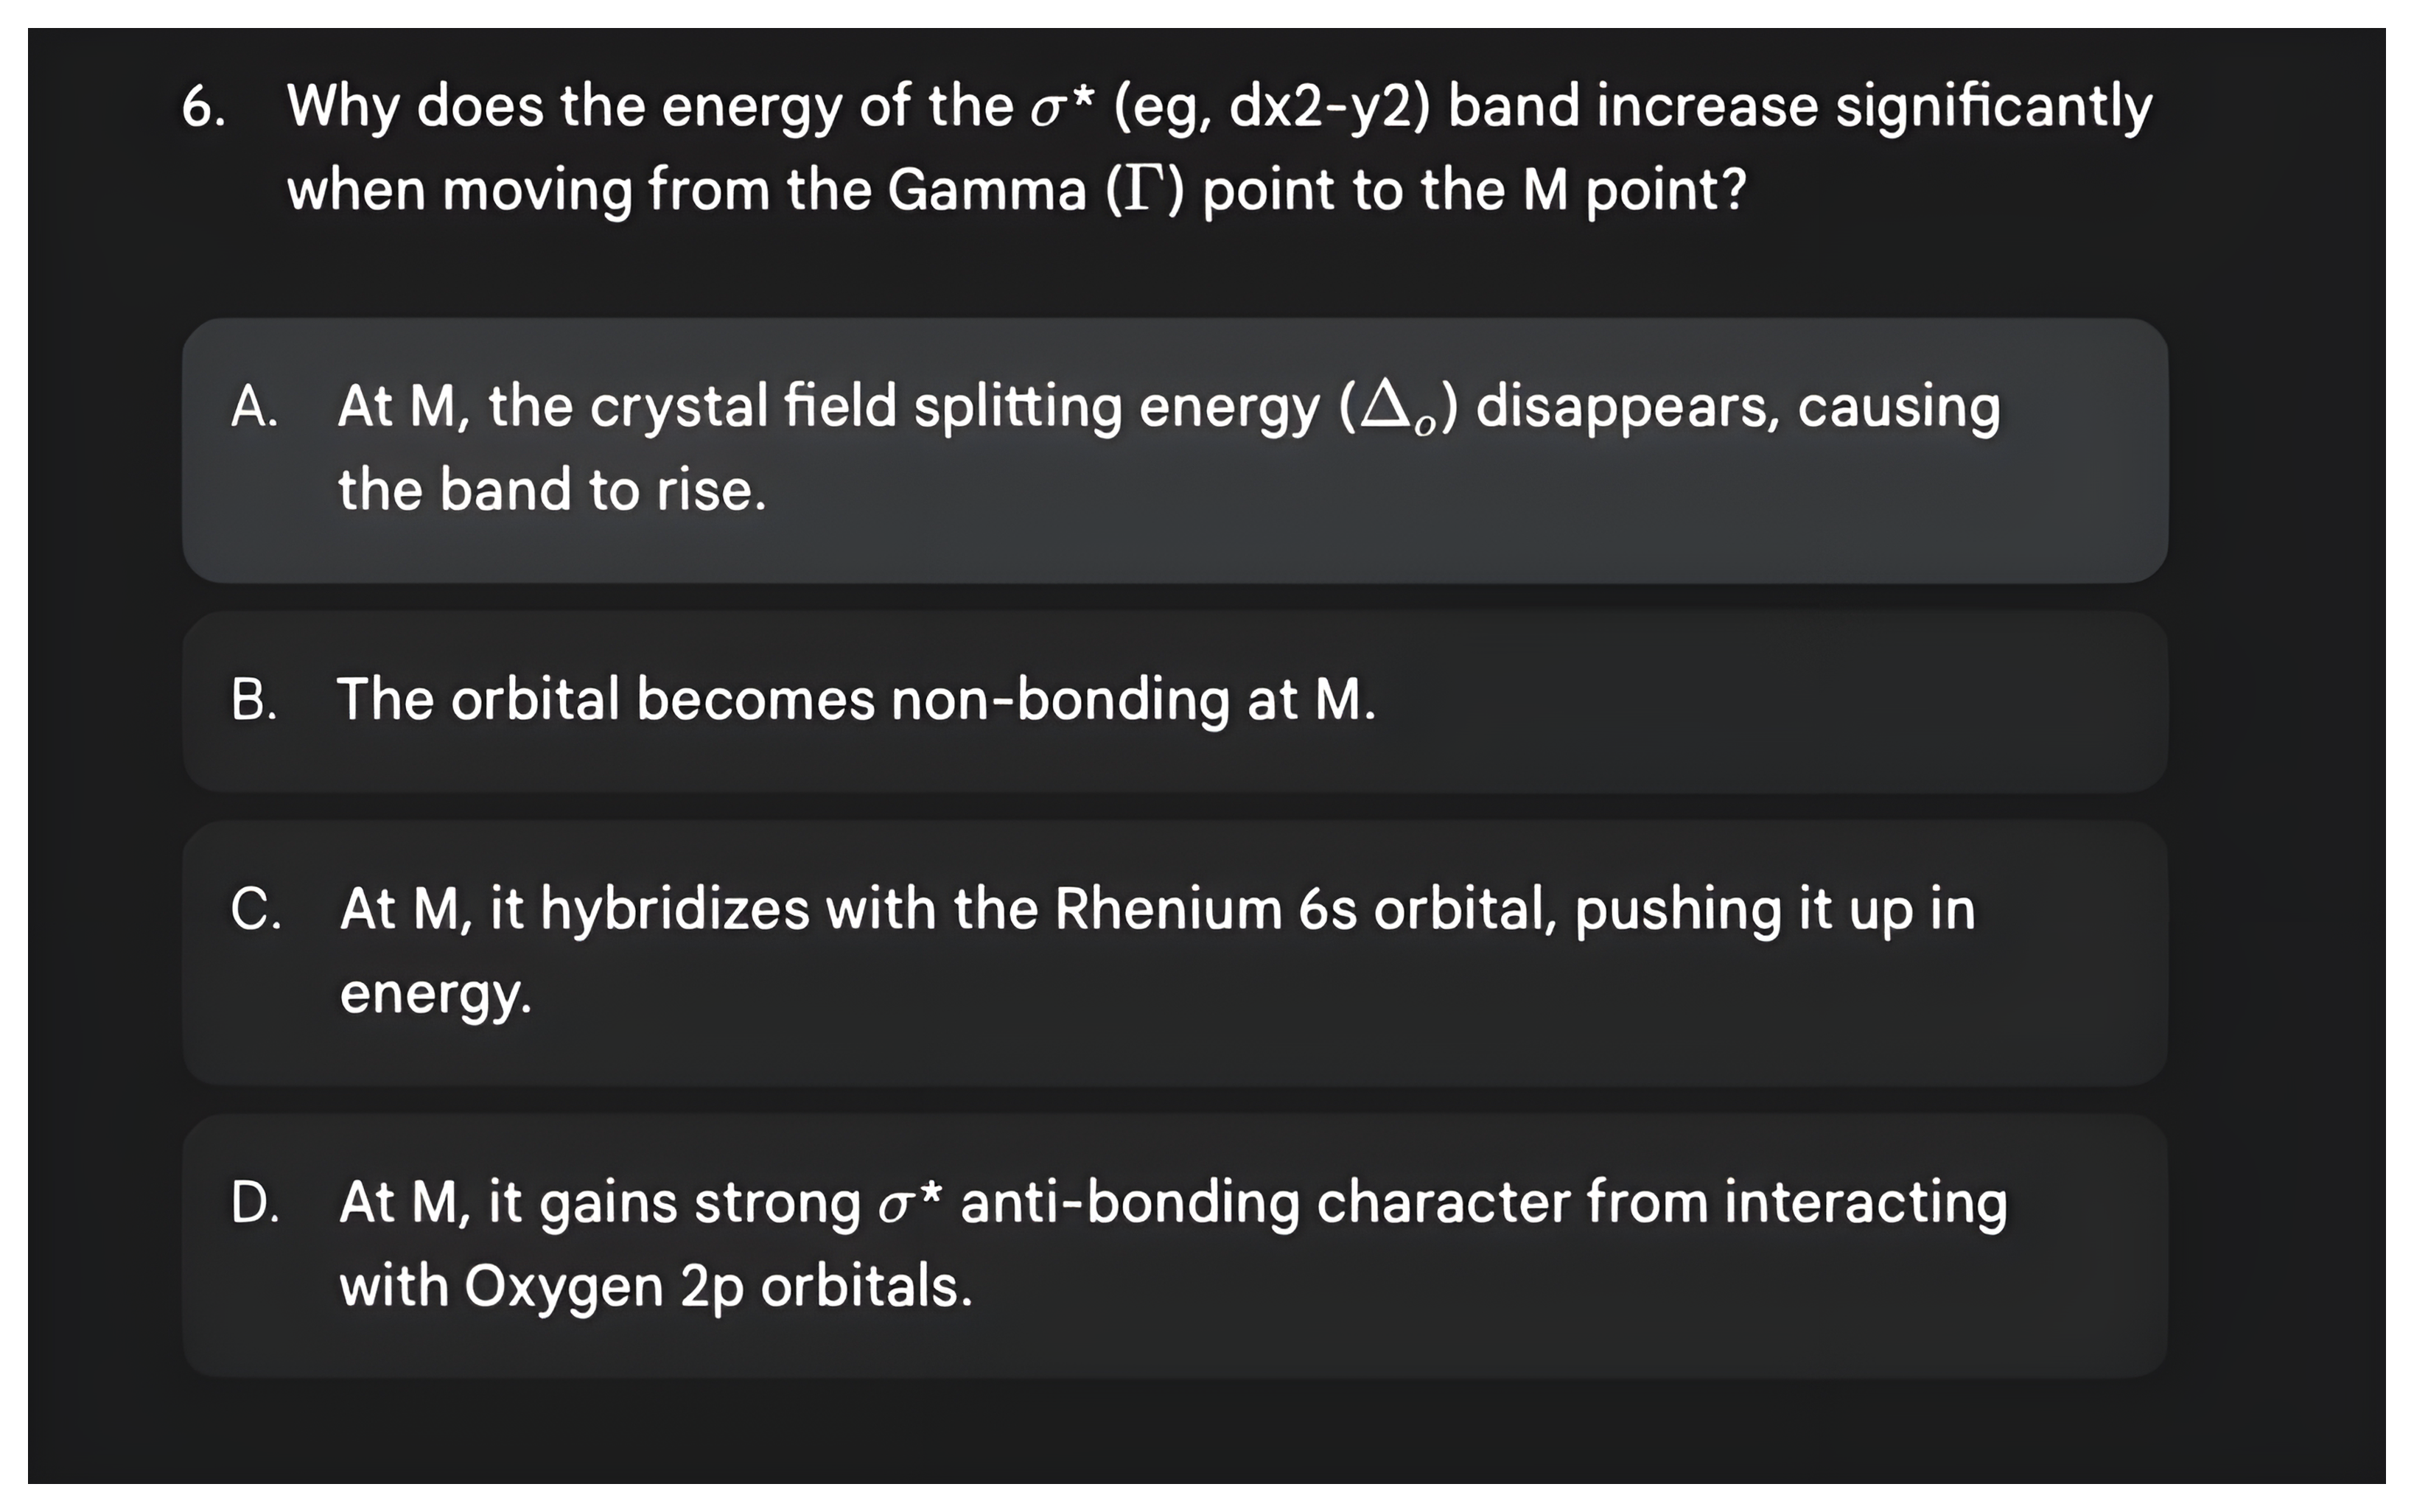
Question 6 asking why the sigma-star eg band rises significantly from Gamma to M, then its answer: at M it gains strong sigma antibonding character from interacting with oxygen 2p orbitals.

Check Your Understanding: Reading Δo from the Bands
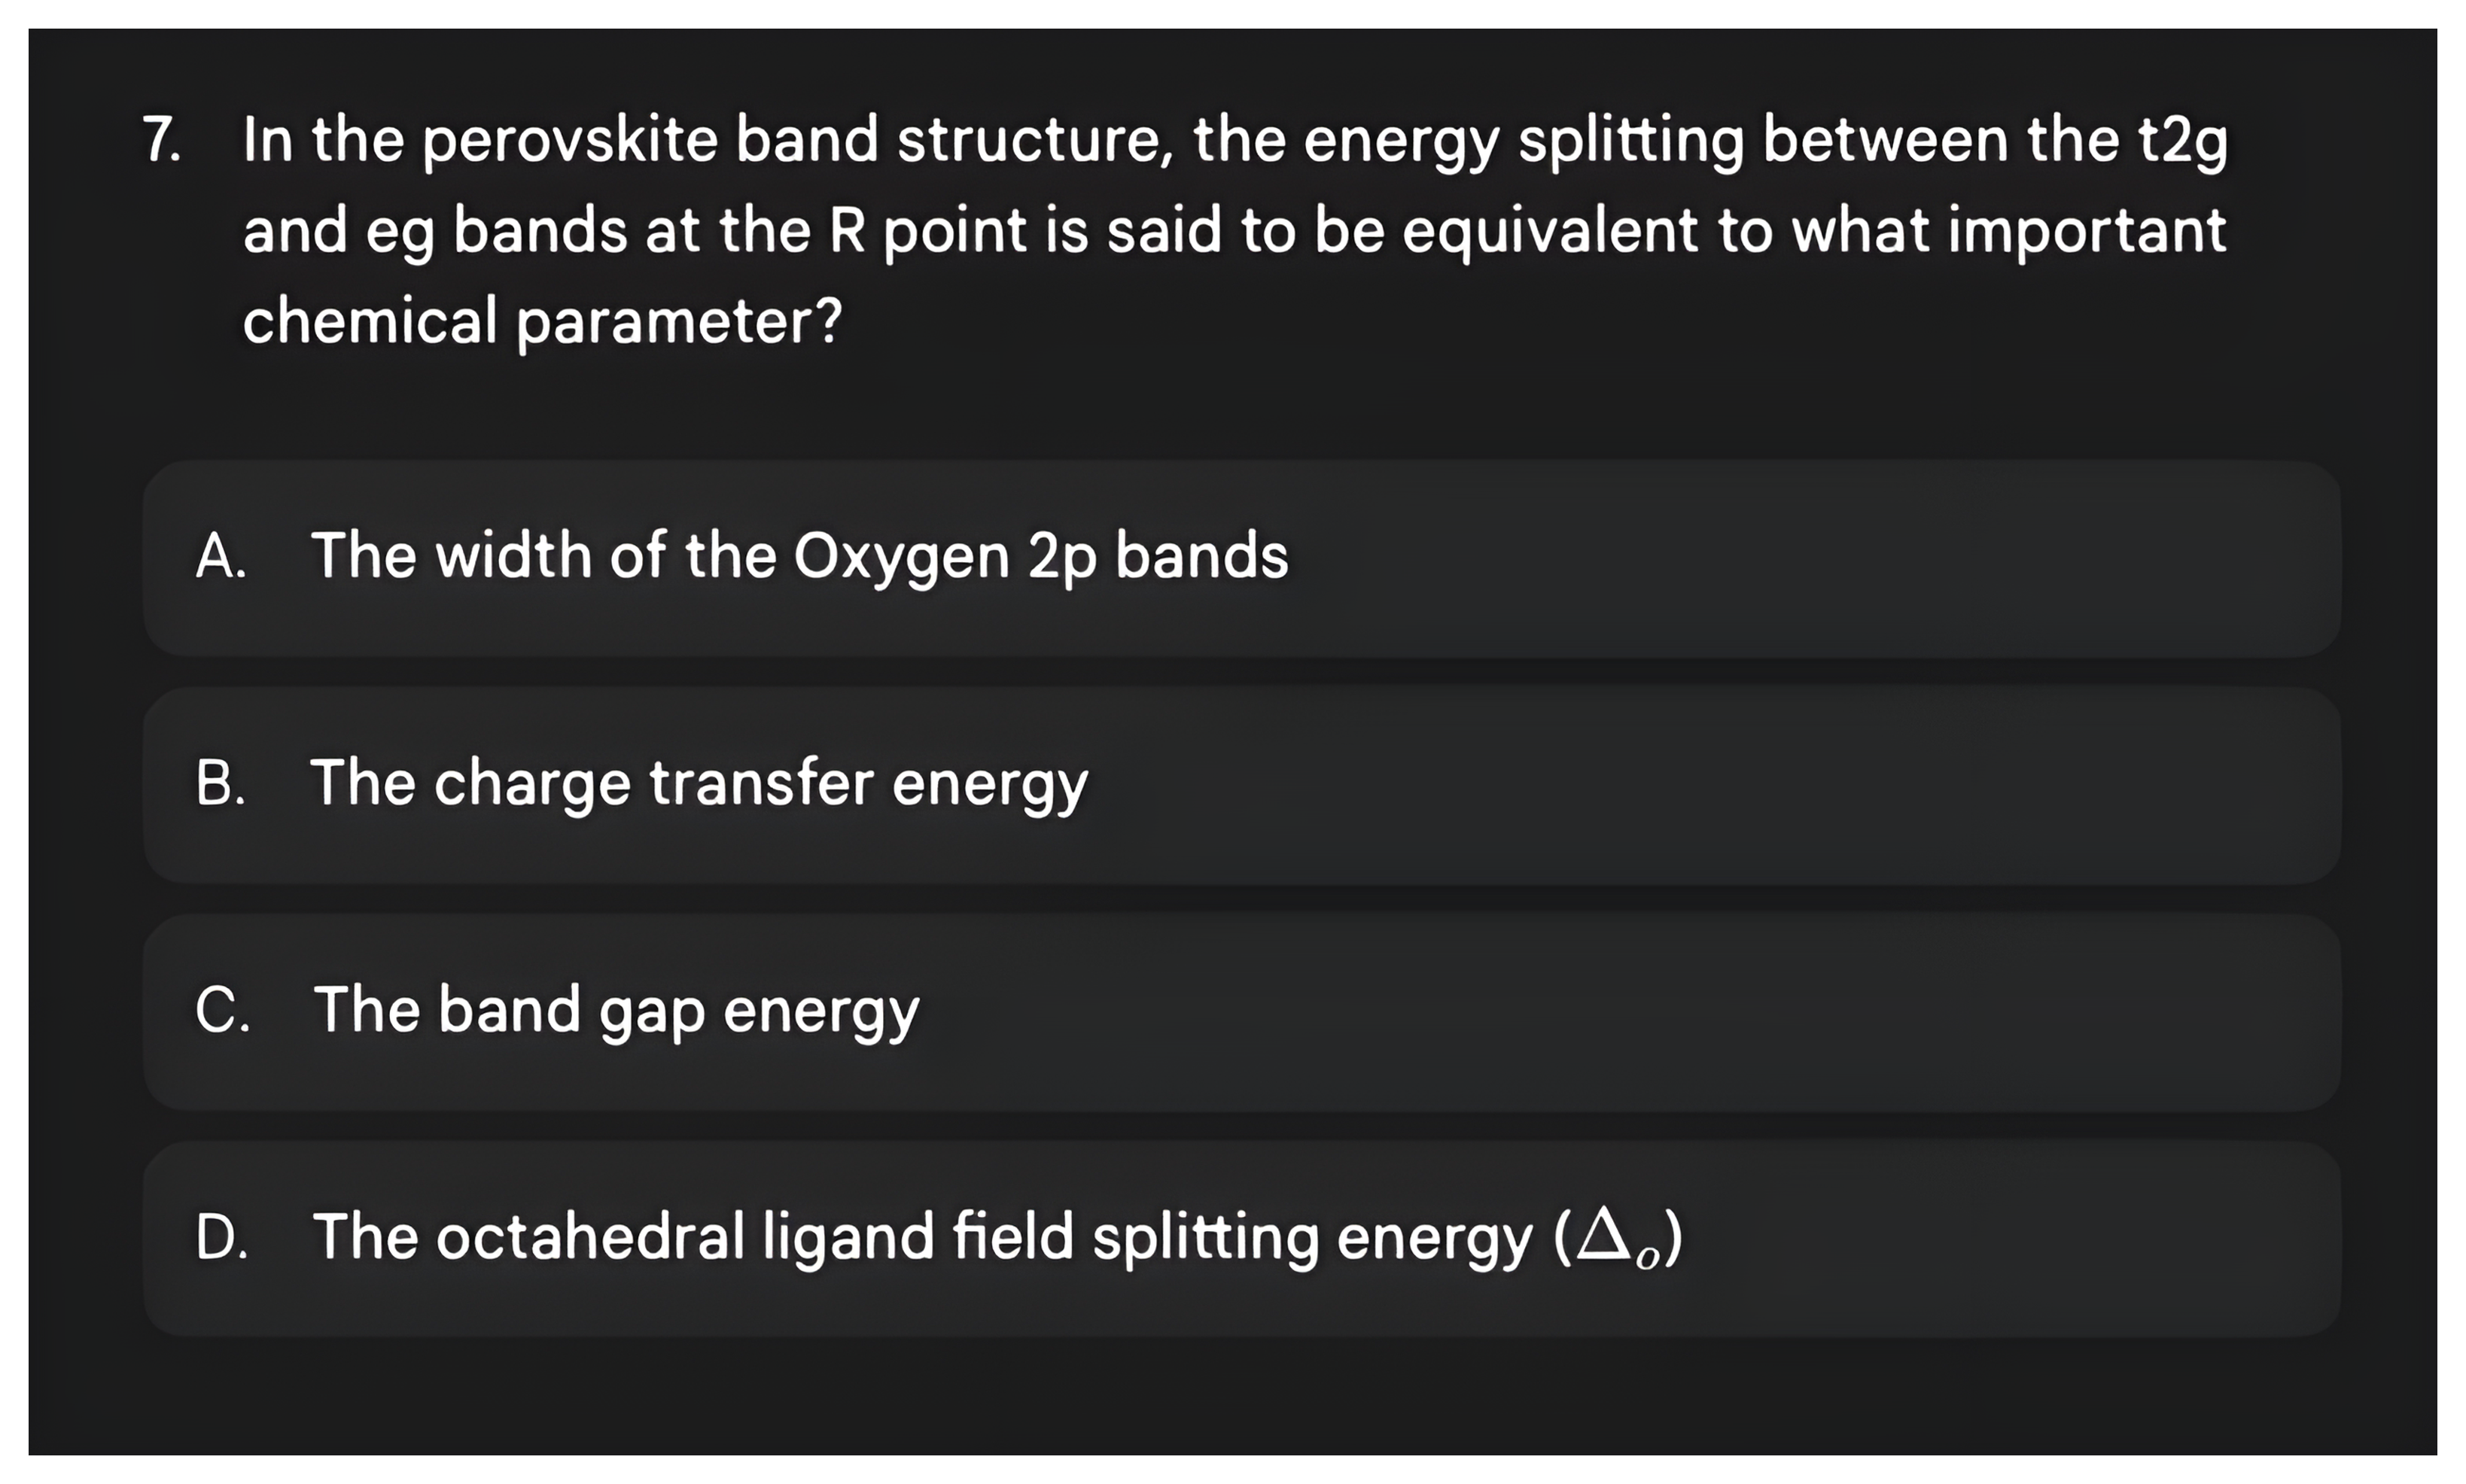
Question 7 asking which chemical parameter equals the t2g to eg splitting at the R point of the perovskite band structure, then its answer: the octahedral ligand field splitting energy.

Check Your Understanding: Periodic Trends
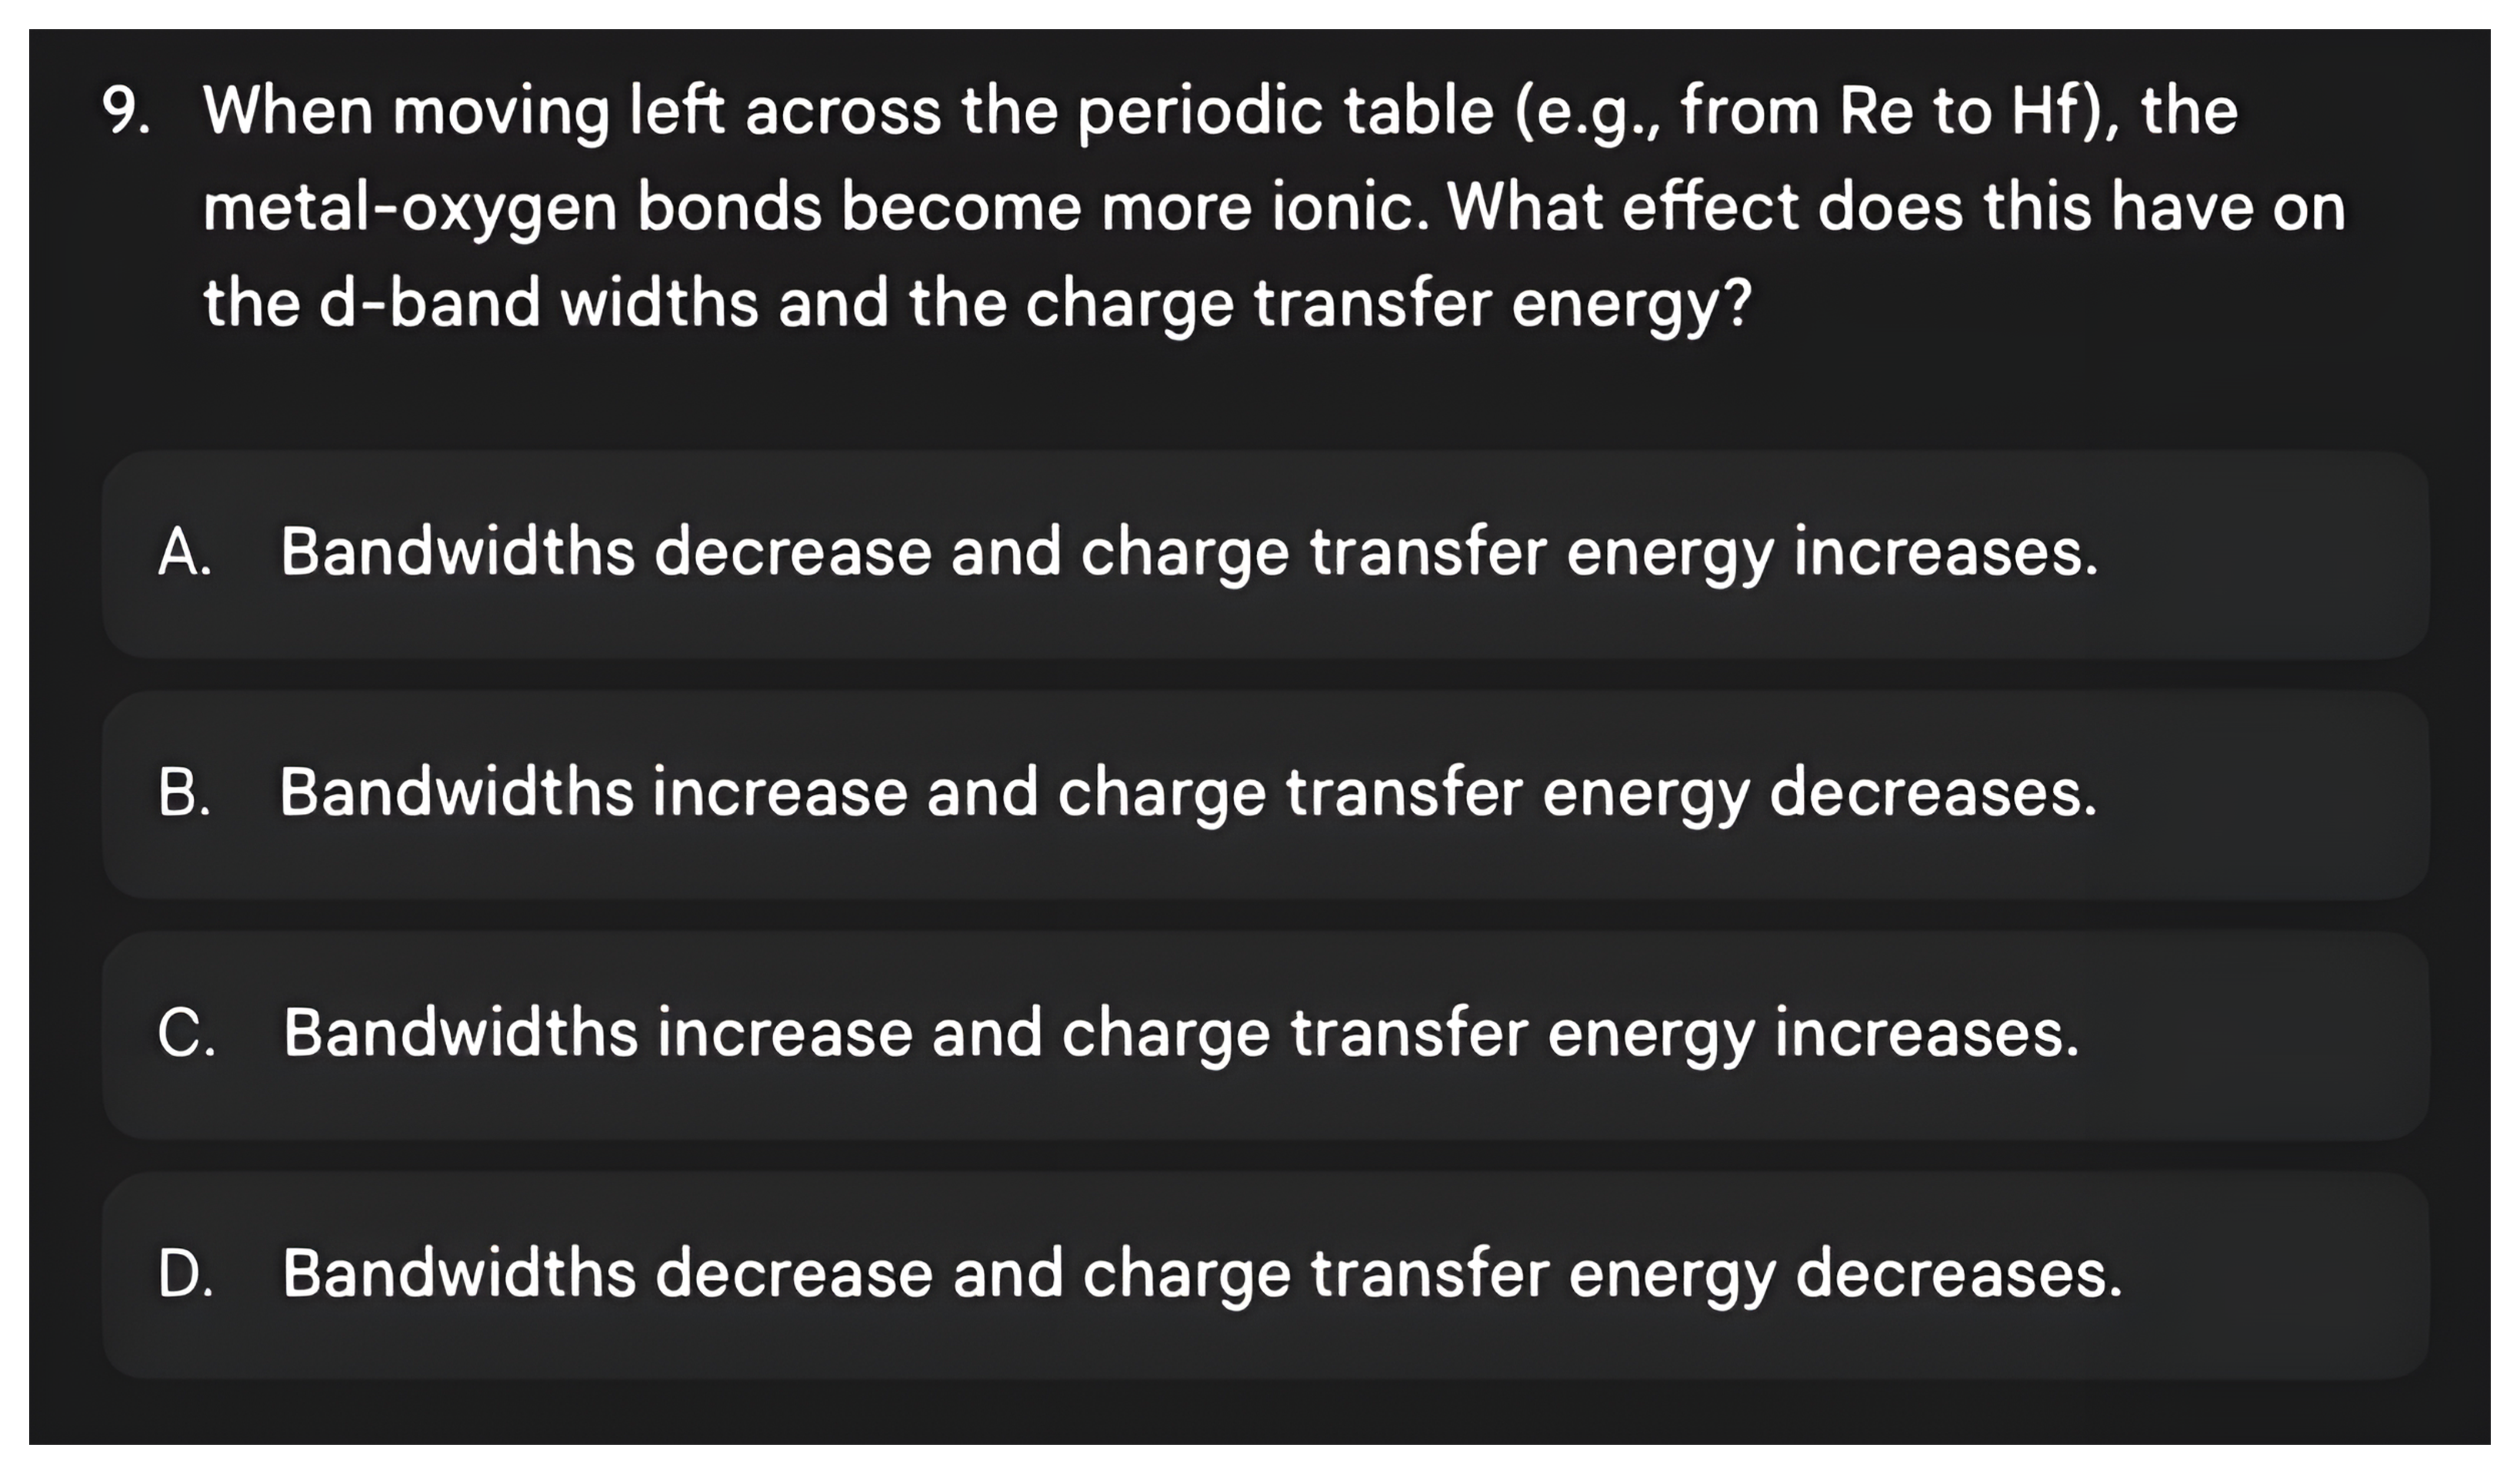
Question 9 asking what happens to the d-band widths and the charge transfer energy as metal-oxygen bonds become more ionic moving left across the periodic table, then its answer: bandwidths decrease and charge transfer energy increases.

Learning Objectives: Conductivity and the Drude Model

Electrical Conductivity and the Drude Model

  • Distinguish between extrinsic (I, V, R) and intrinsic (J, E, σ, ρ) electrical properties
  • Apply the Drude model to describe electron behavior as an ideal gas in metals
  • Calculate key parameters: drift velocity, electron mobility, mean free path, and relaxation time
  • Derive the relationship between conductivity, carrier concentration, and mobility (σ = neμ)
  • Estimate conductivity parameters for simple metals using the Drude model
  • Recognize the limitations and failures of the Drude model in predicting temperature dependence and trends across different metals

Electrical Properties of Materials | Materials Science & Chemistry

Ohm's Law
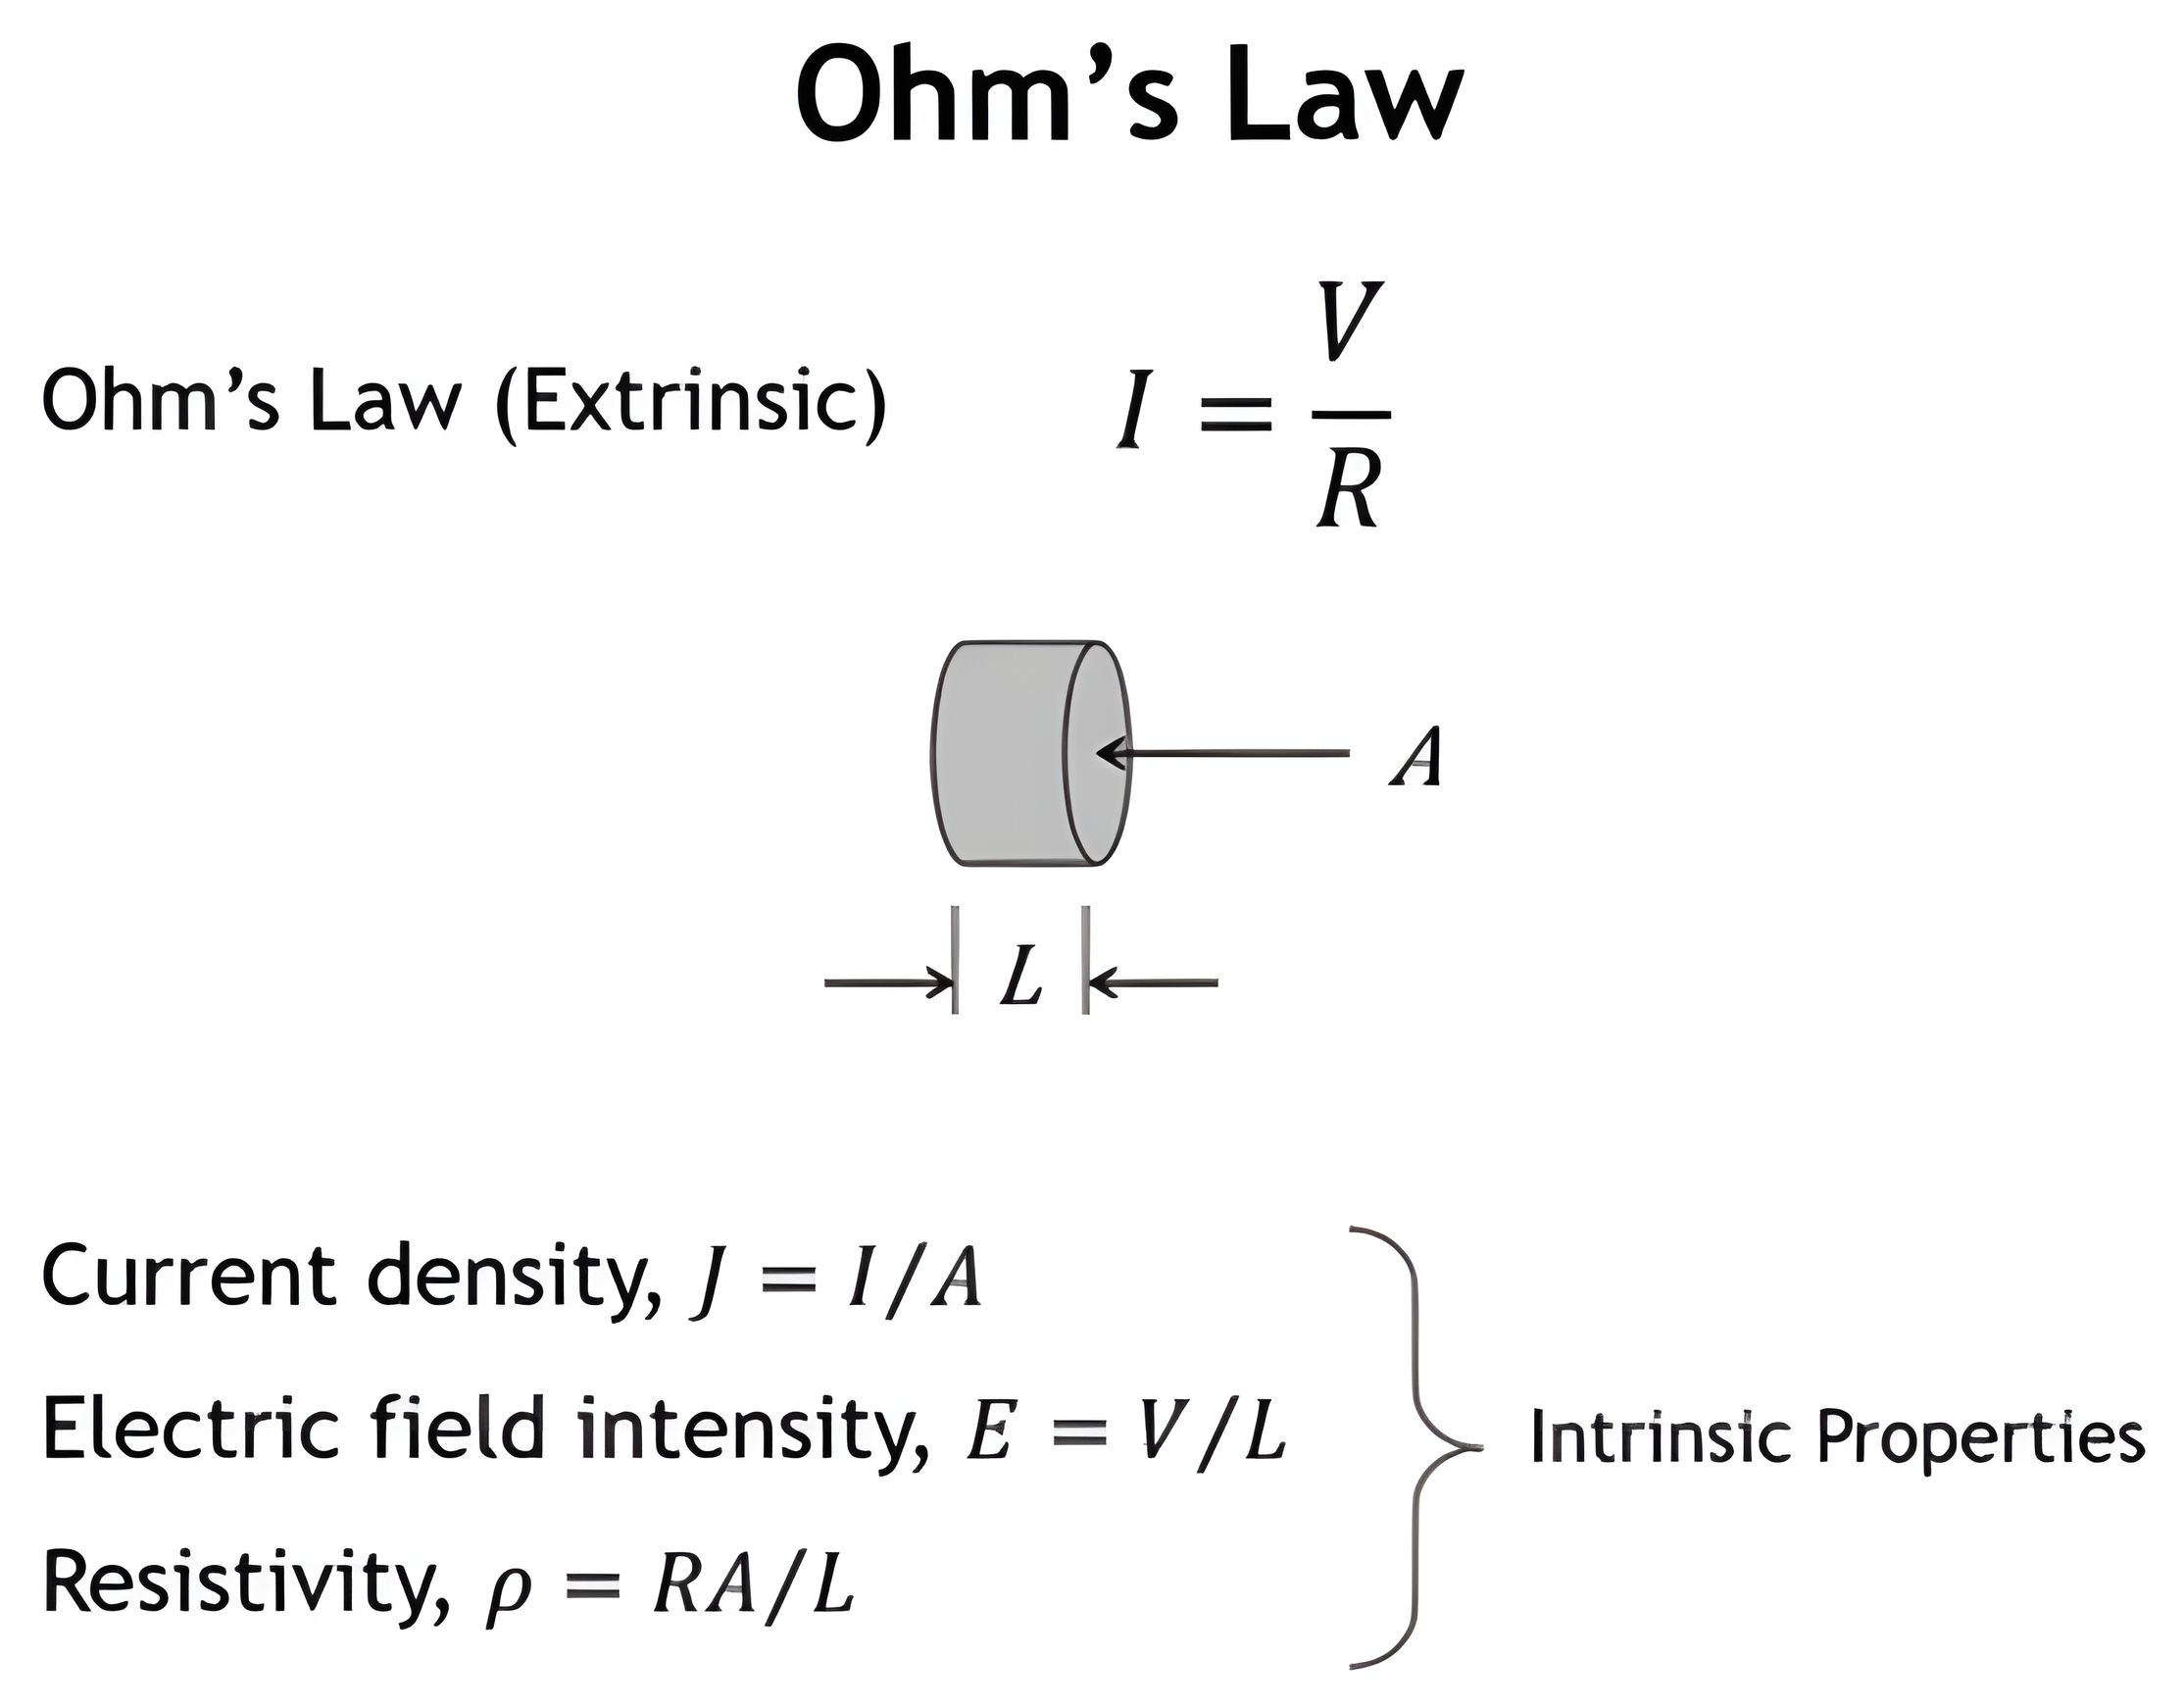
Ohm's law in extrinsic form, I equals V over R, with a cylindrical sample of area A and length L, and the intrinsic properties: current density J equals I over A, electric field E equals V over L, and resistivity rho equals R A over L.

Conductivity

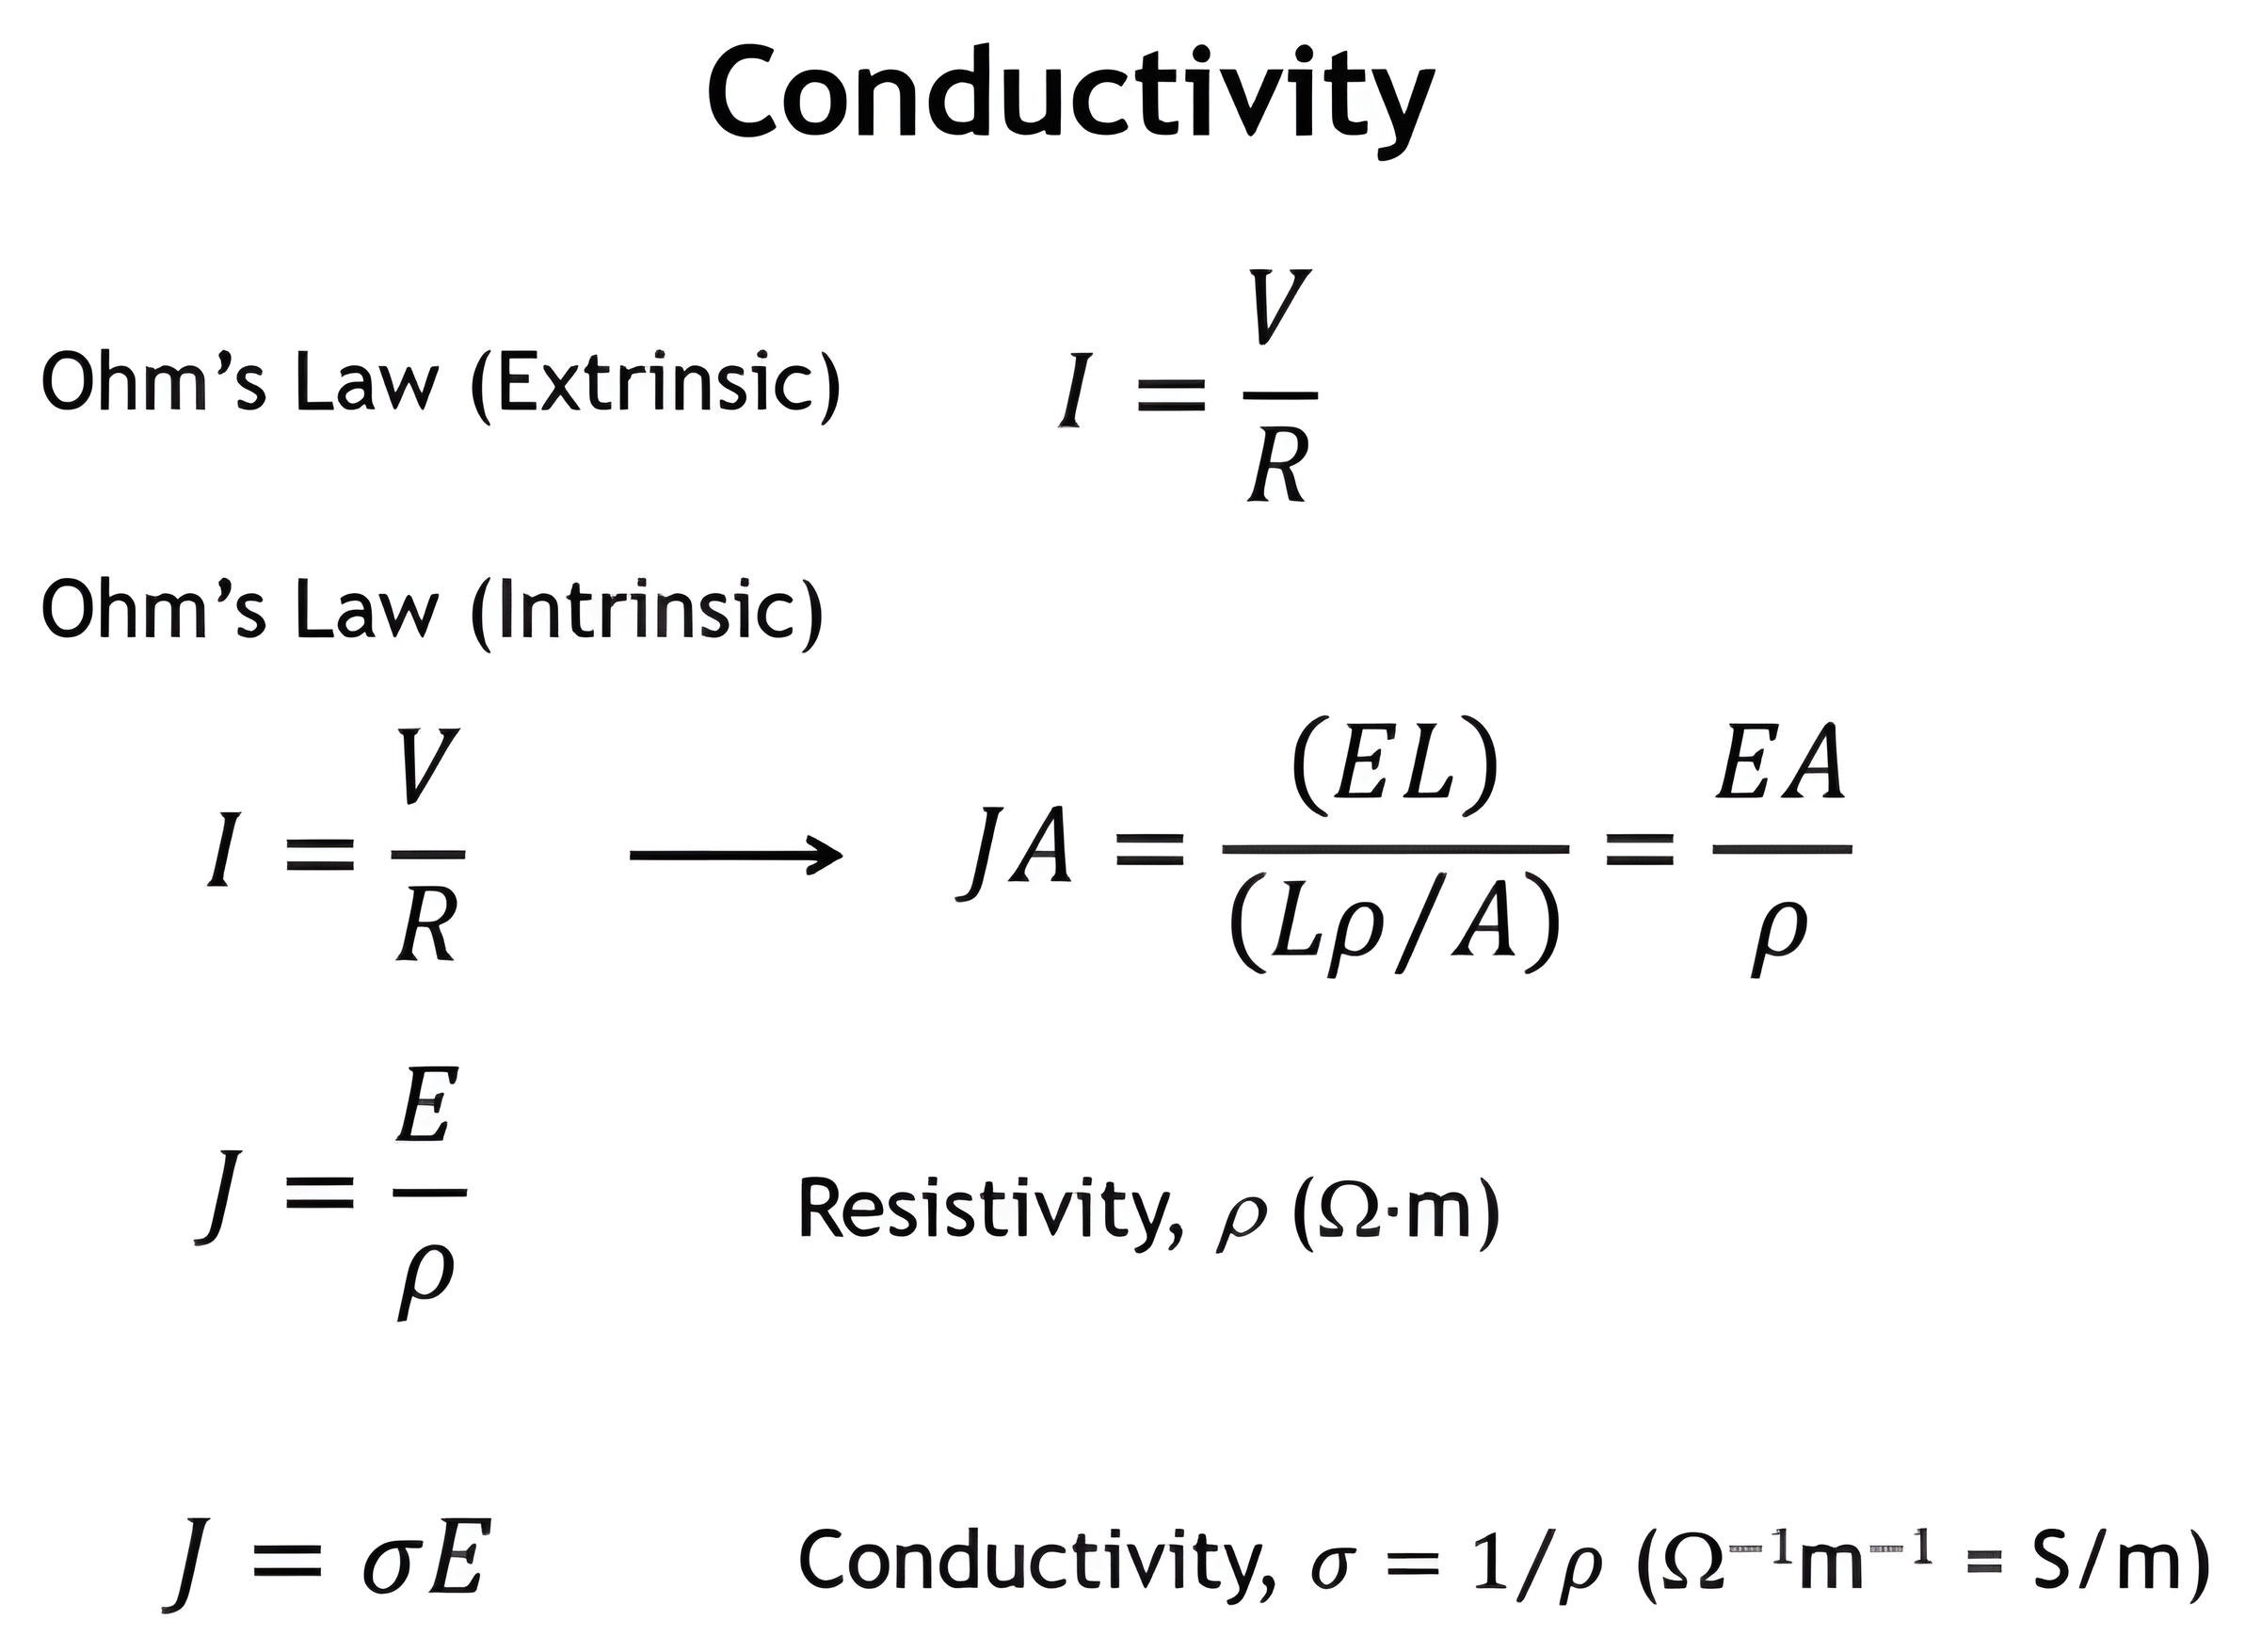
Recasting Ohm's law into intrinsic form: J A equals E L over rho L over A, which reduces to J equals E over rho, and with conductivity sigma equals one over rho, J equals sigma E; resistivity in ohm meters, conductivity in siemens per meter.

Conductivity of Materials

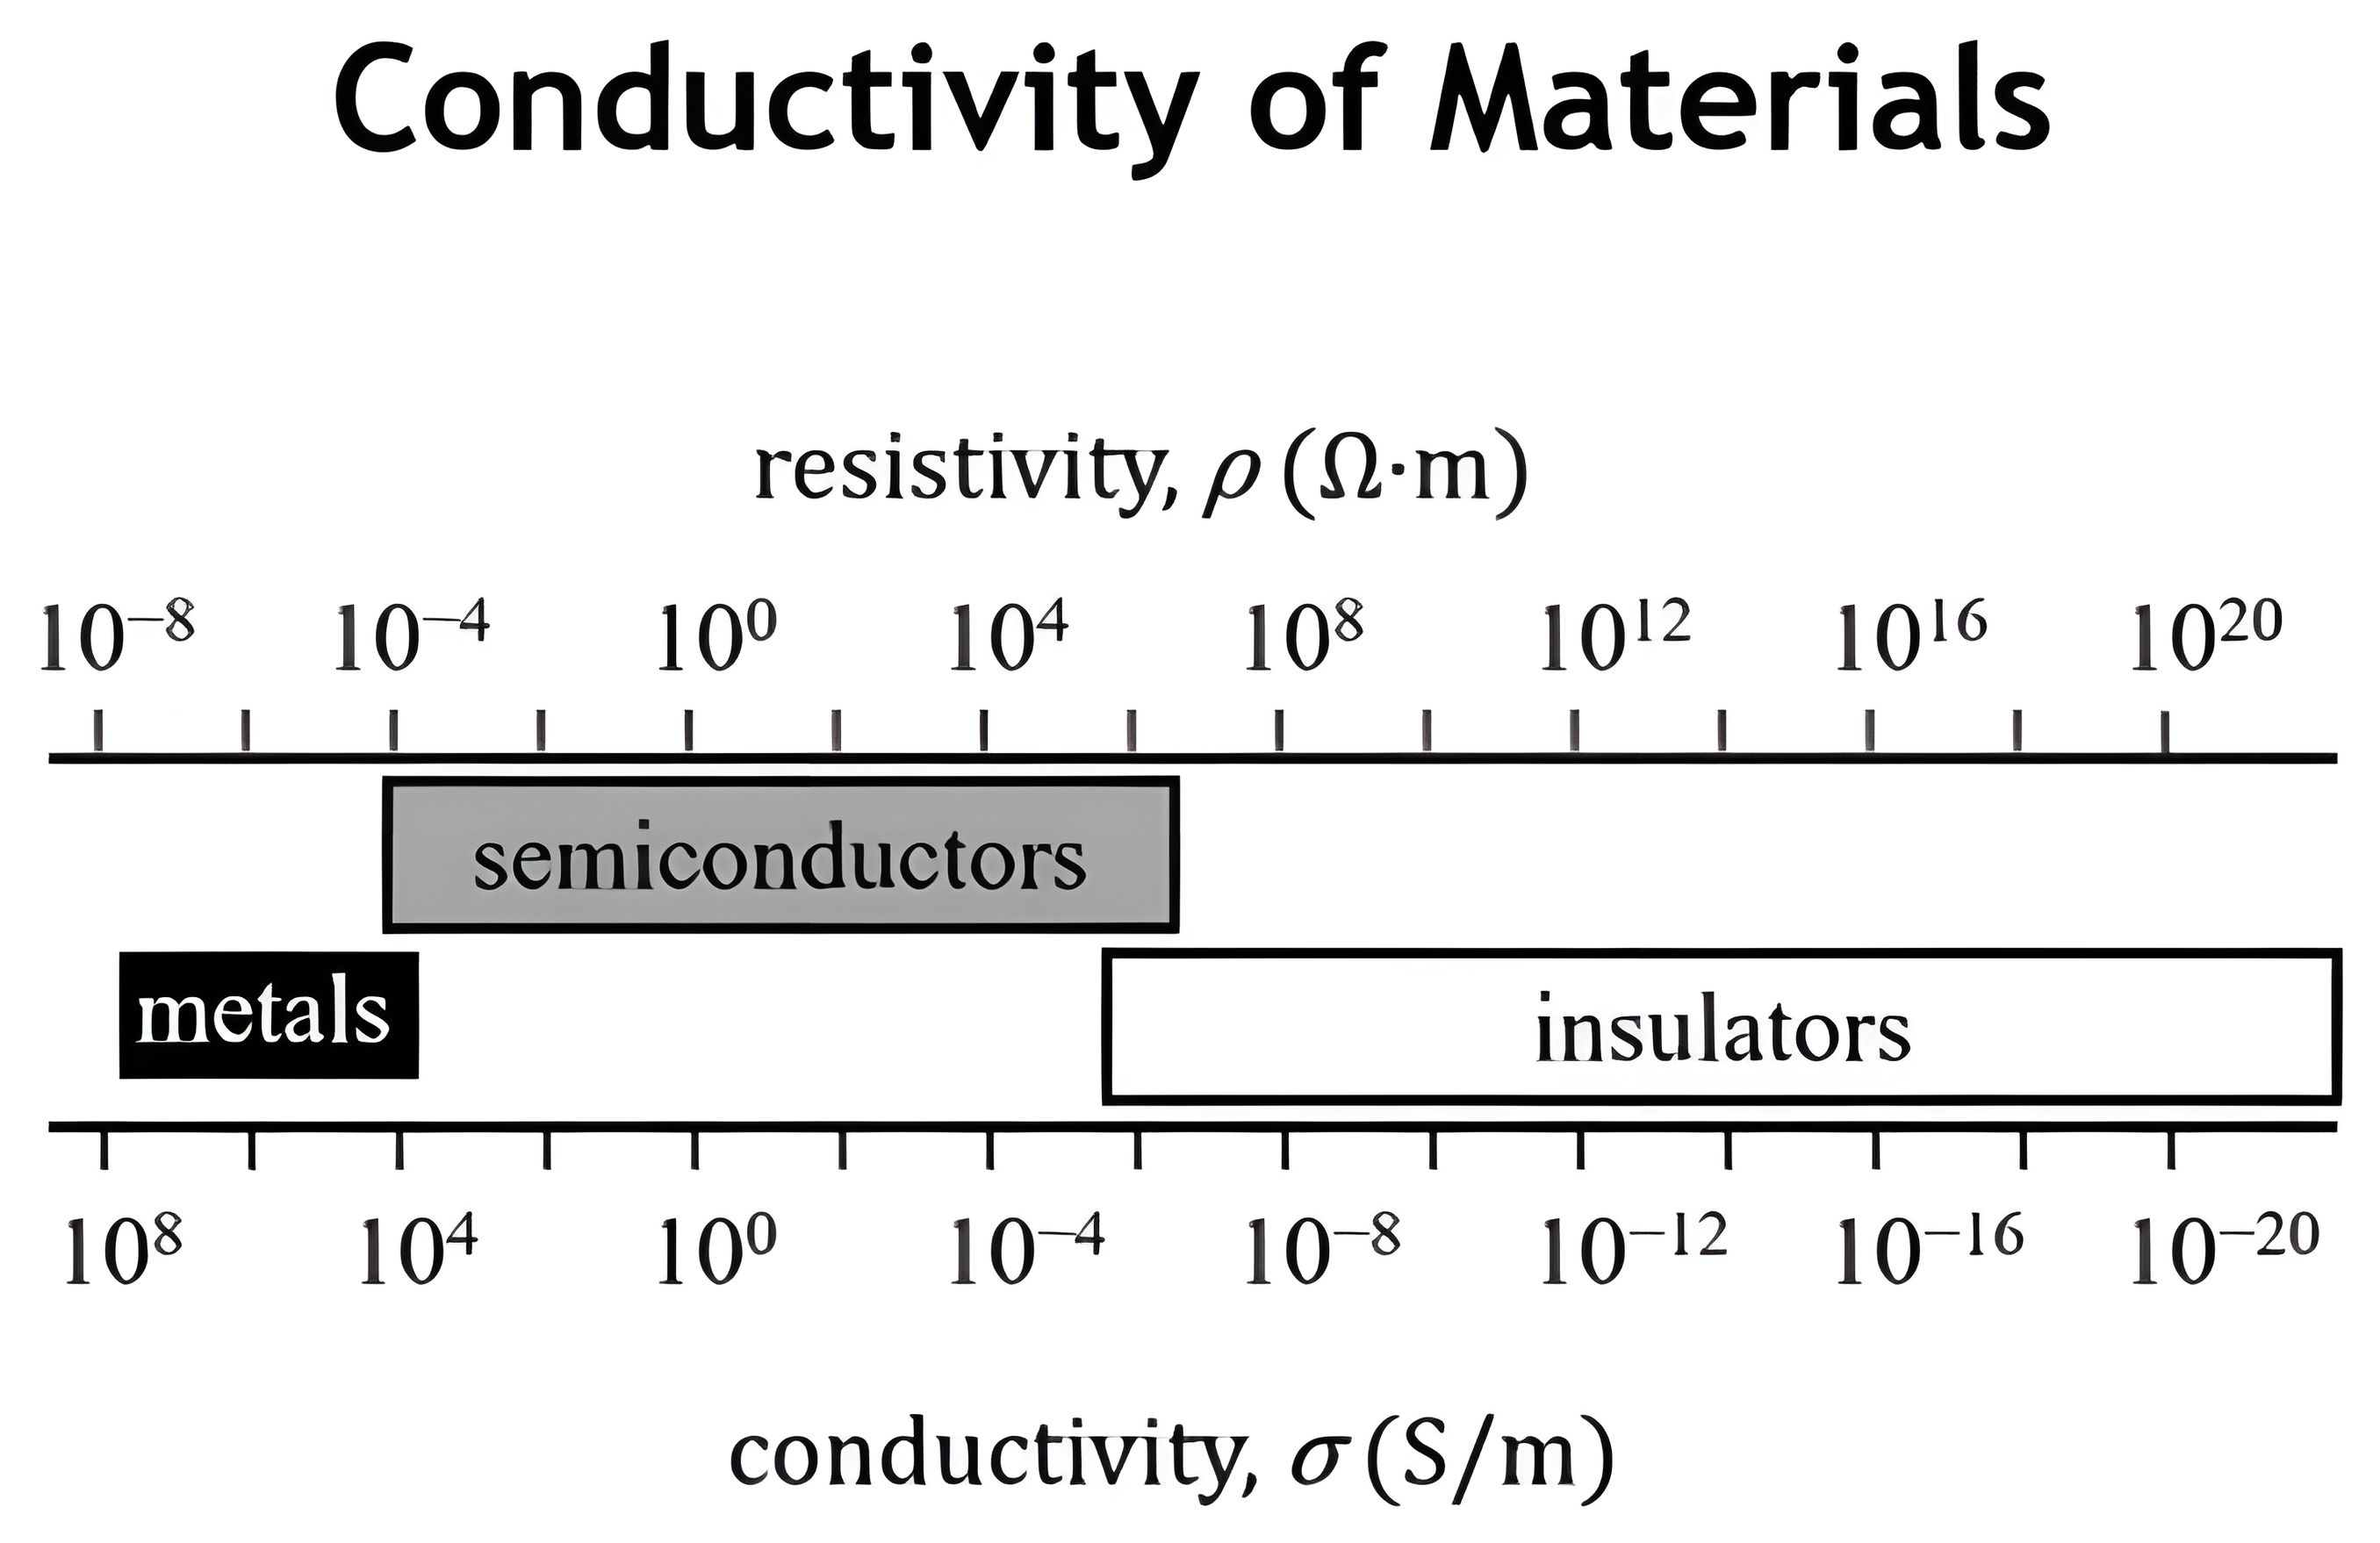
A logarithmic scale of resistivity and conductivity spanning 28 orders of magnitude, with metals at high conductivity, semiconductors intermediate, and insulators at low conductivity.

Conductivity of Select Materials

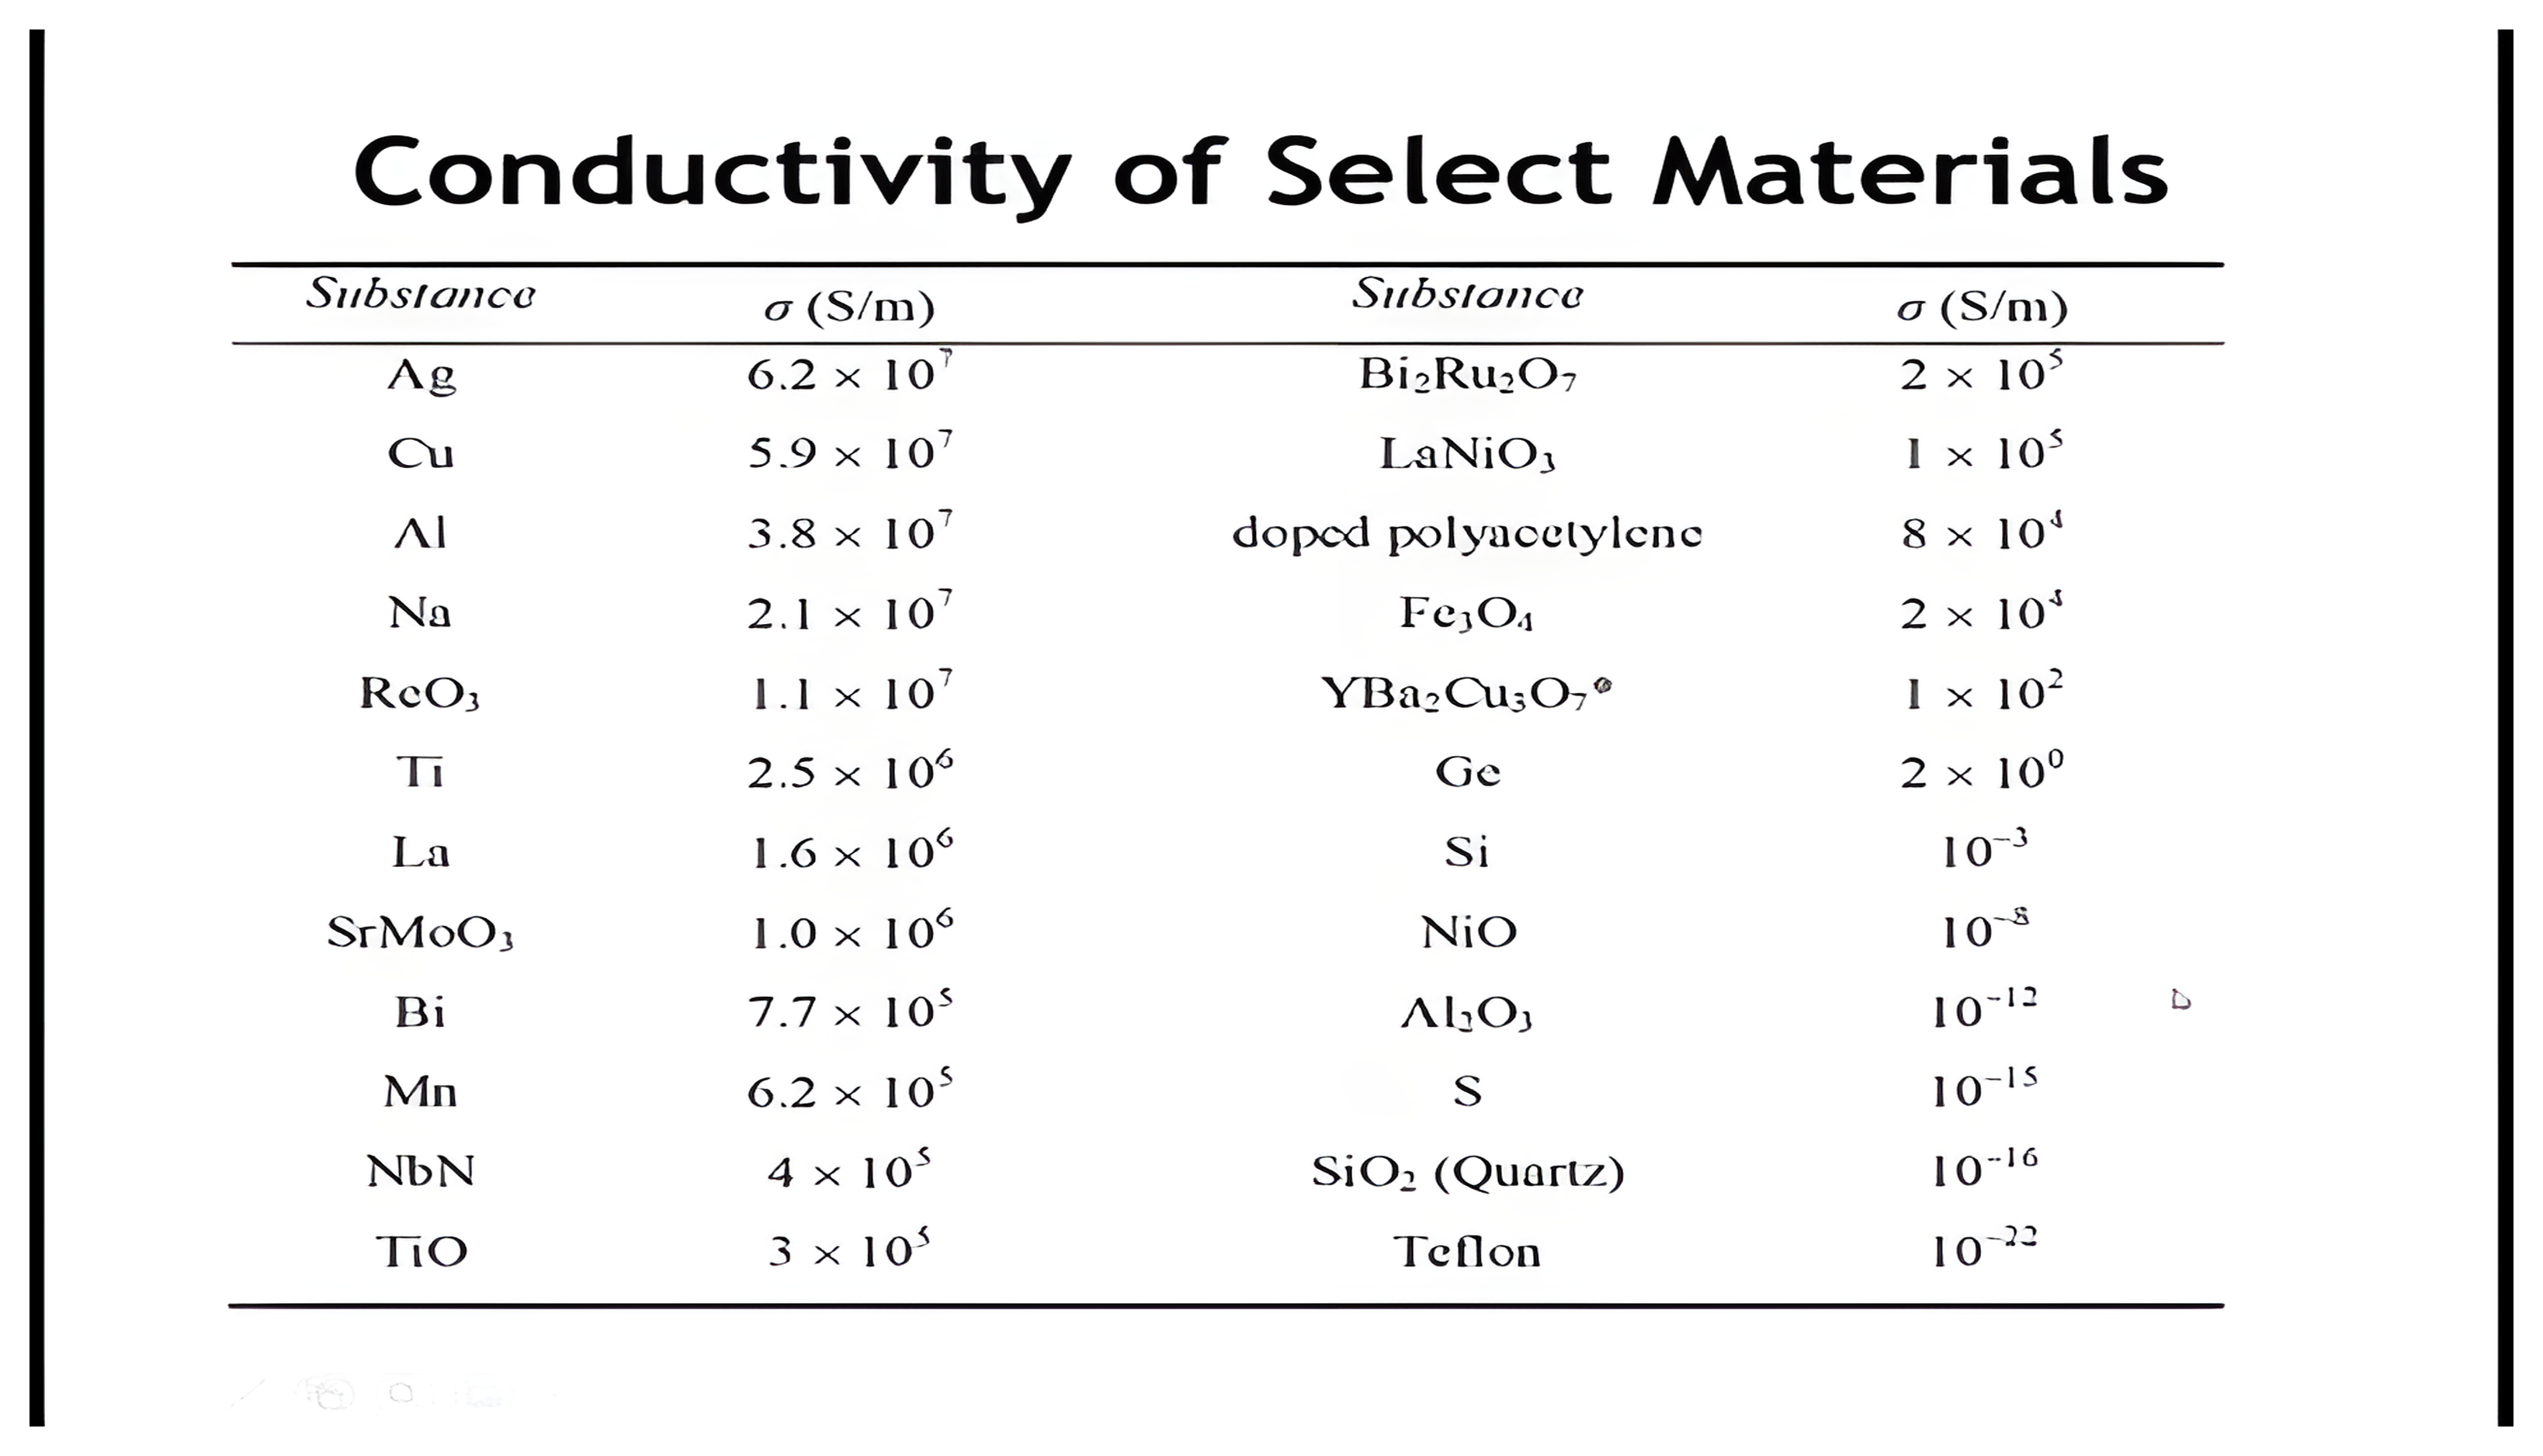
A table of conductivities for selected materials, from silver and copper near 6 times 10 to the 7 siemens per meter, through ReO3, SrMoO3, NbN, and doped polyacetylene, down to NiO, Al2O3, SiO2, and Teflon at 10 to the minus 22.
CHEM 548