CHEM 548: Materials Chemistry
Phase Diagrams: Binary, Ternary, and Free Energy
Reading: Woodward, Karen, Evans, and Vogt, Solid State Materials Chemistry
Ch. 4 §§4.2–4.3
Binary Phase Diagrams Part 2
Learning Objectives
By the end of this lecture, you should be able to:
- Interpret binary phase diagrams that include an intermediate compound.
- Distinguish between congruent and incongruent melting behaviors.
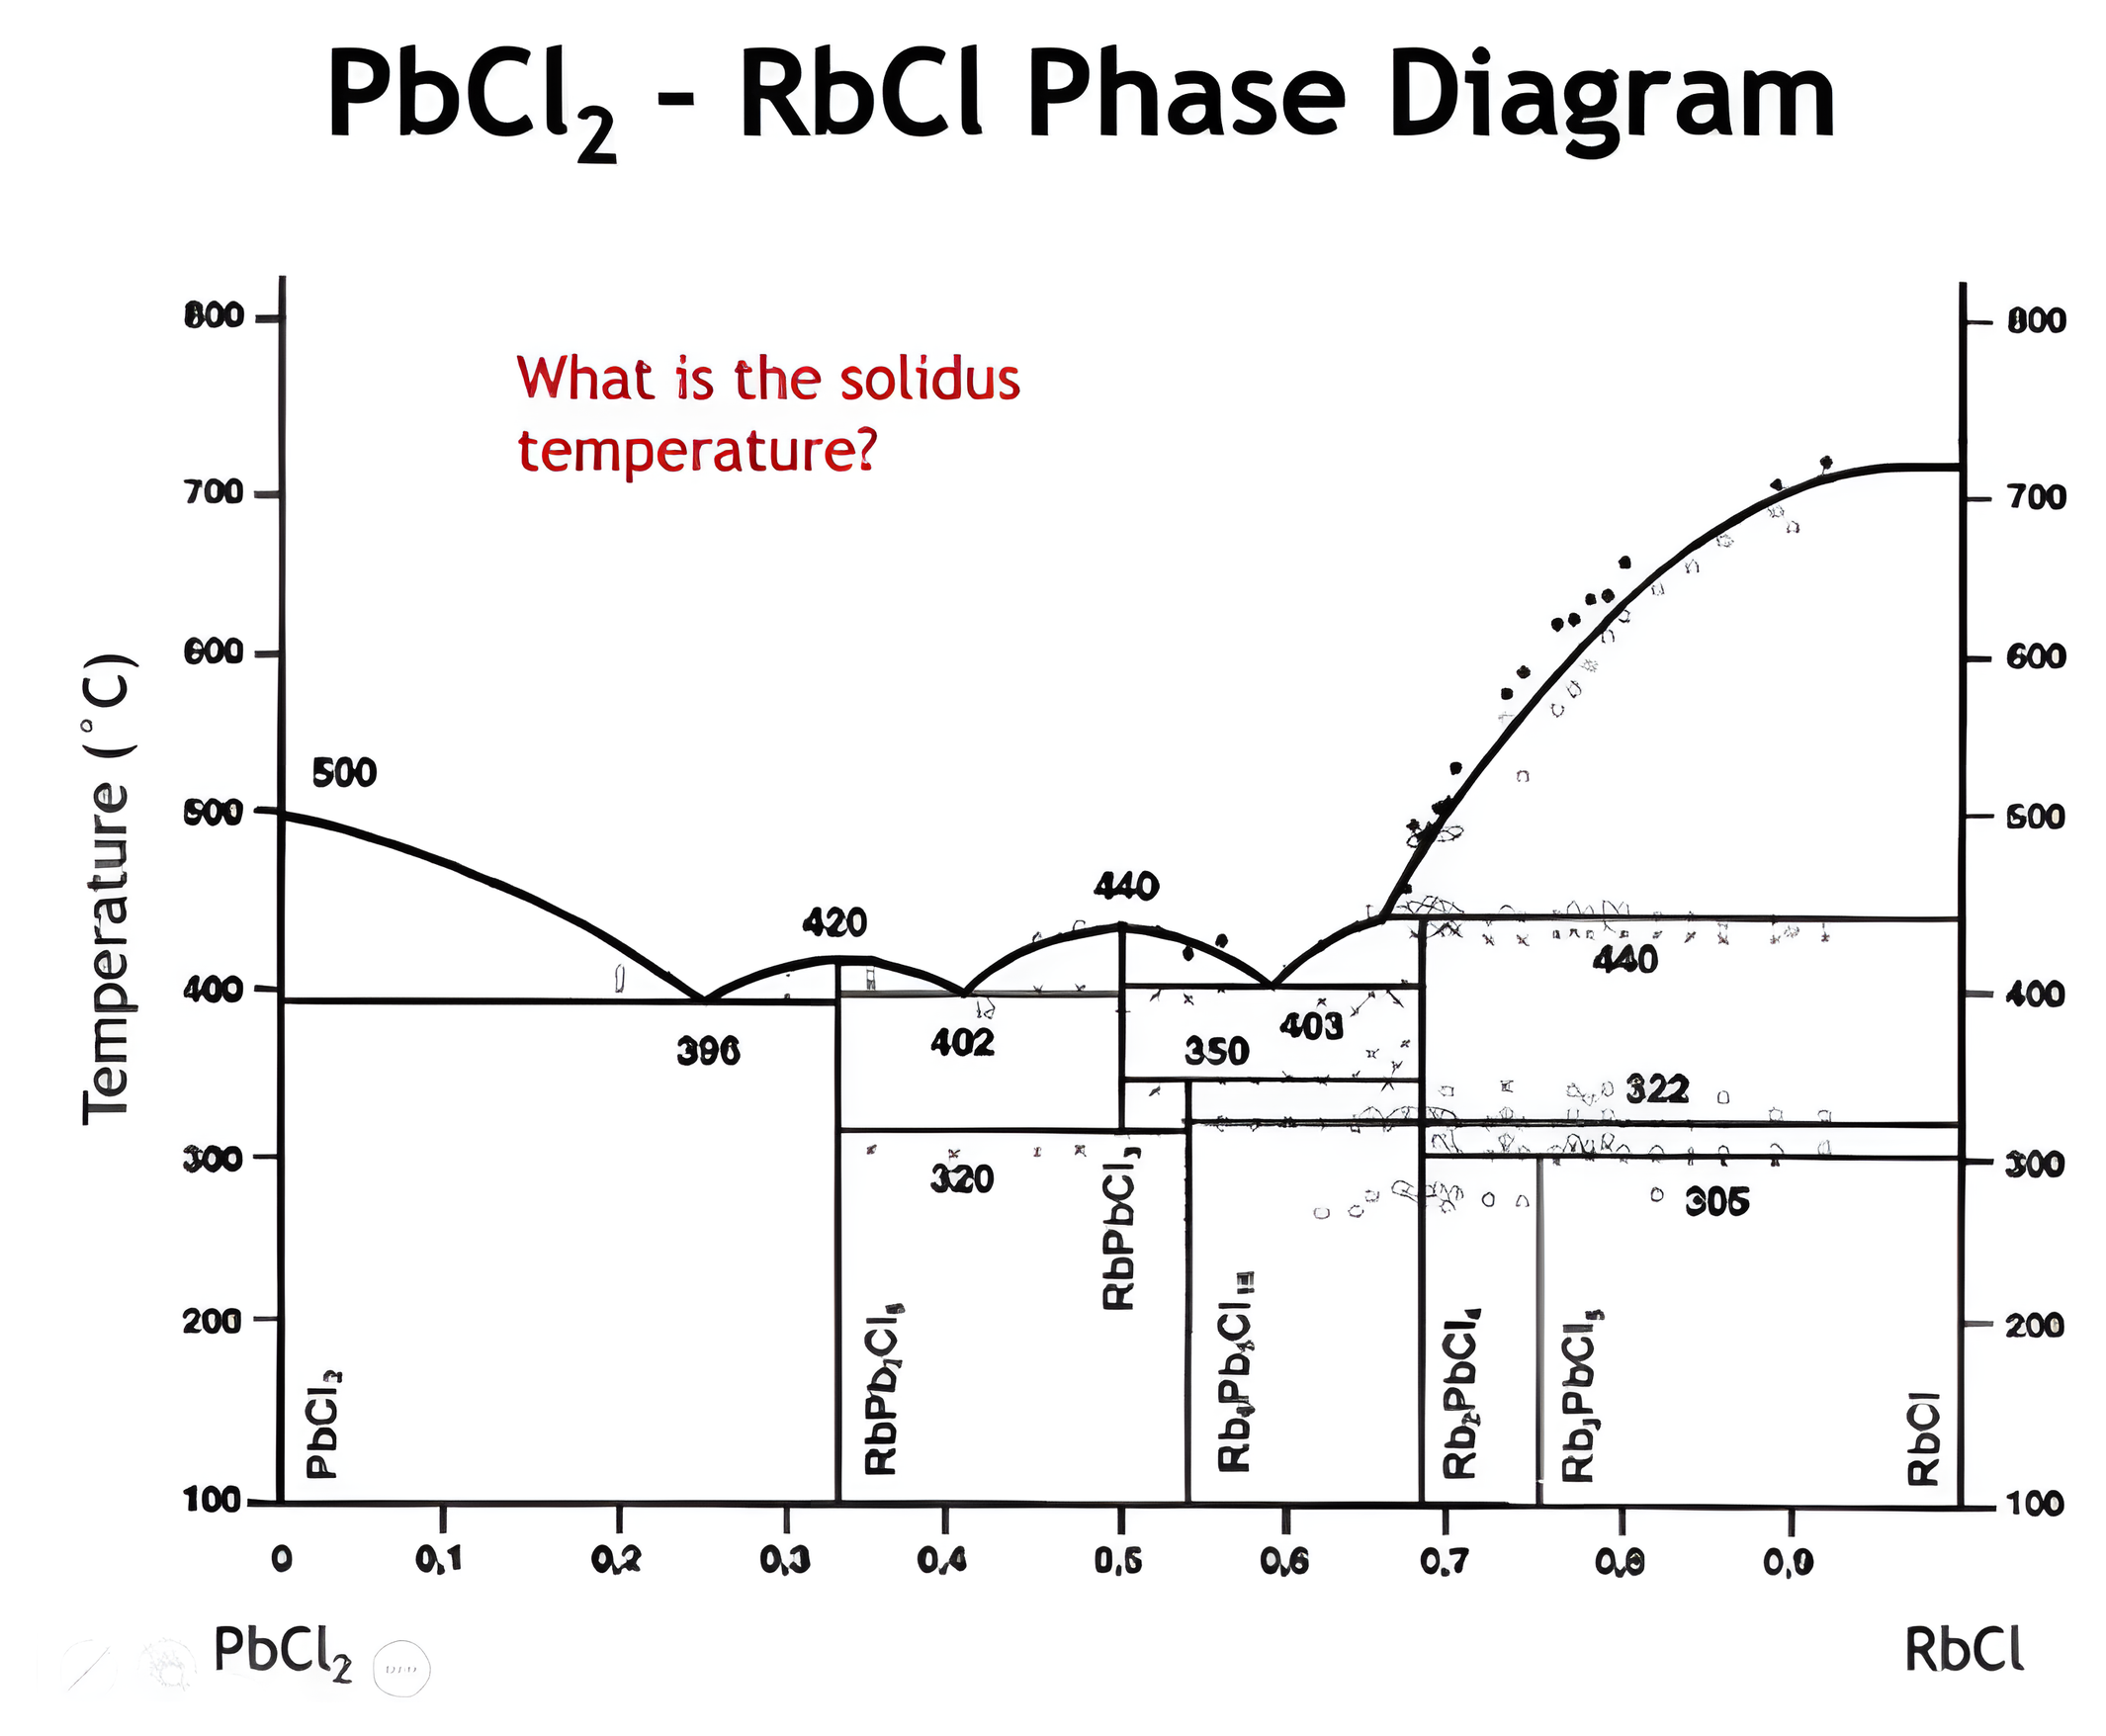
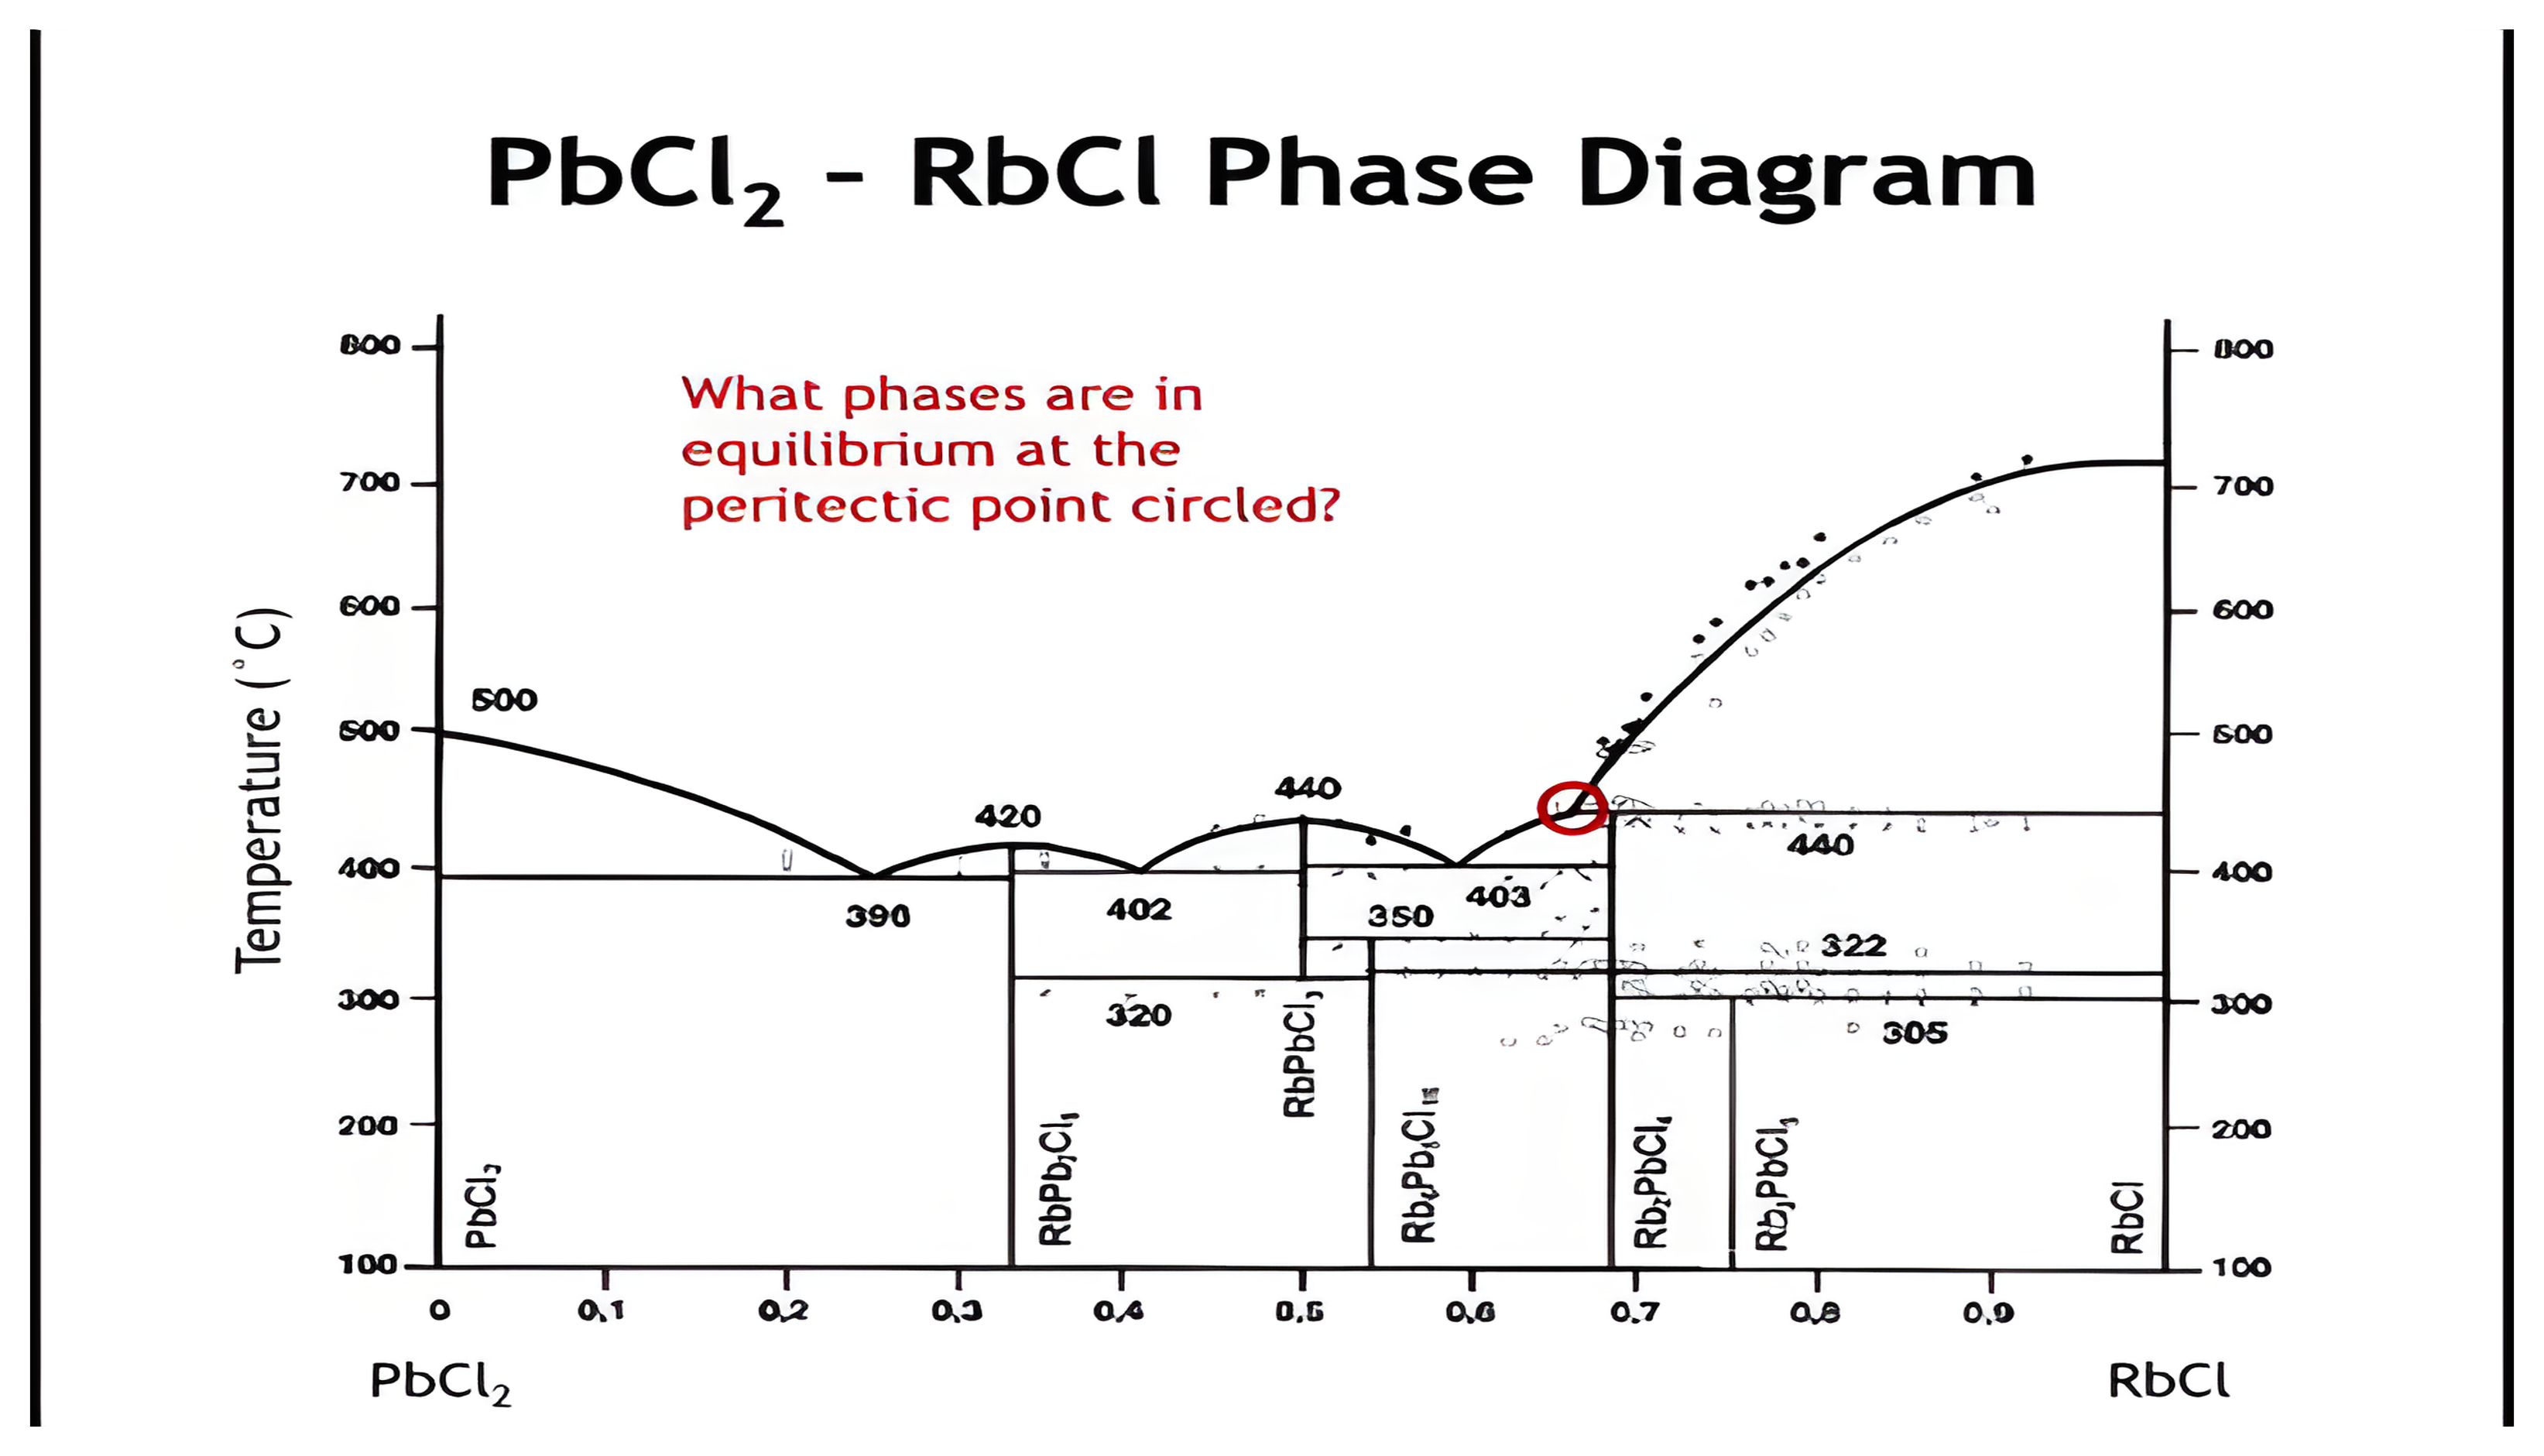
- Identify eutectic and peritectic points and explain their significance.
- Predict which phases are in equilibrium at given regions of a diagram.
- Assess strategies for growing single crystals of intermediate compounds.
Summary
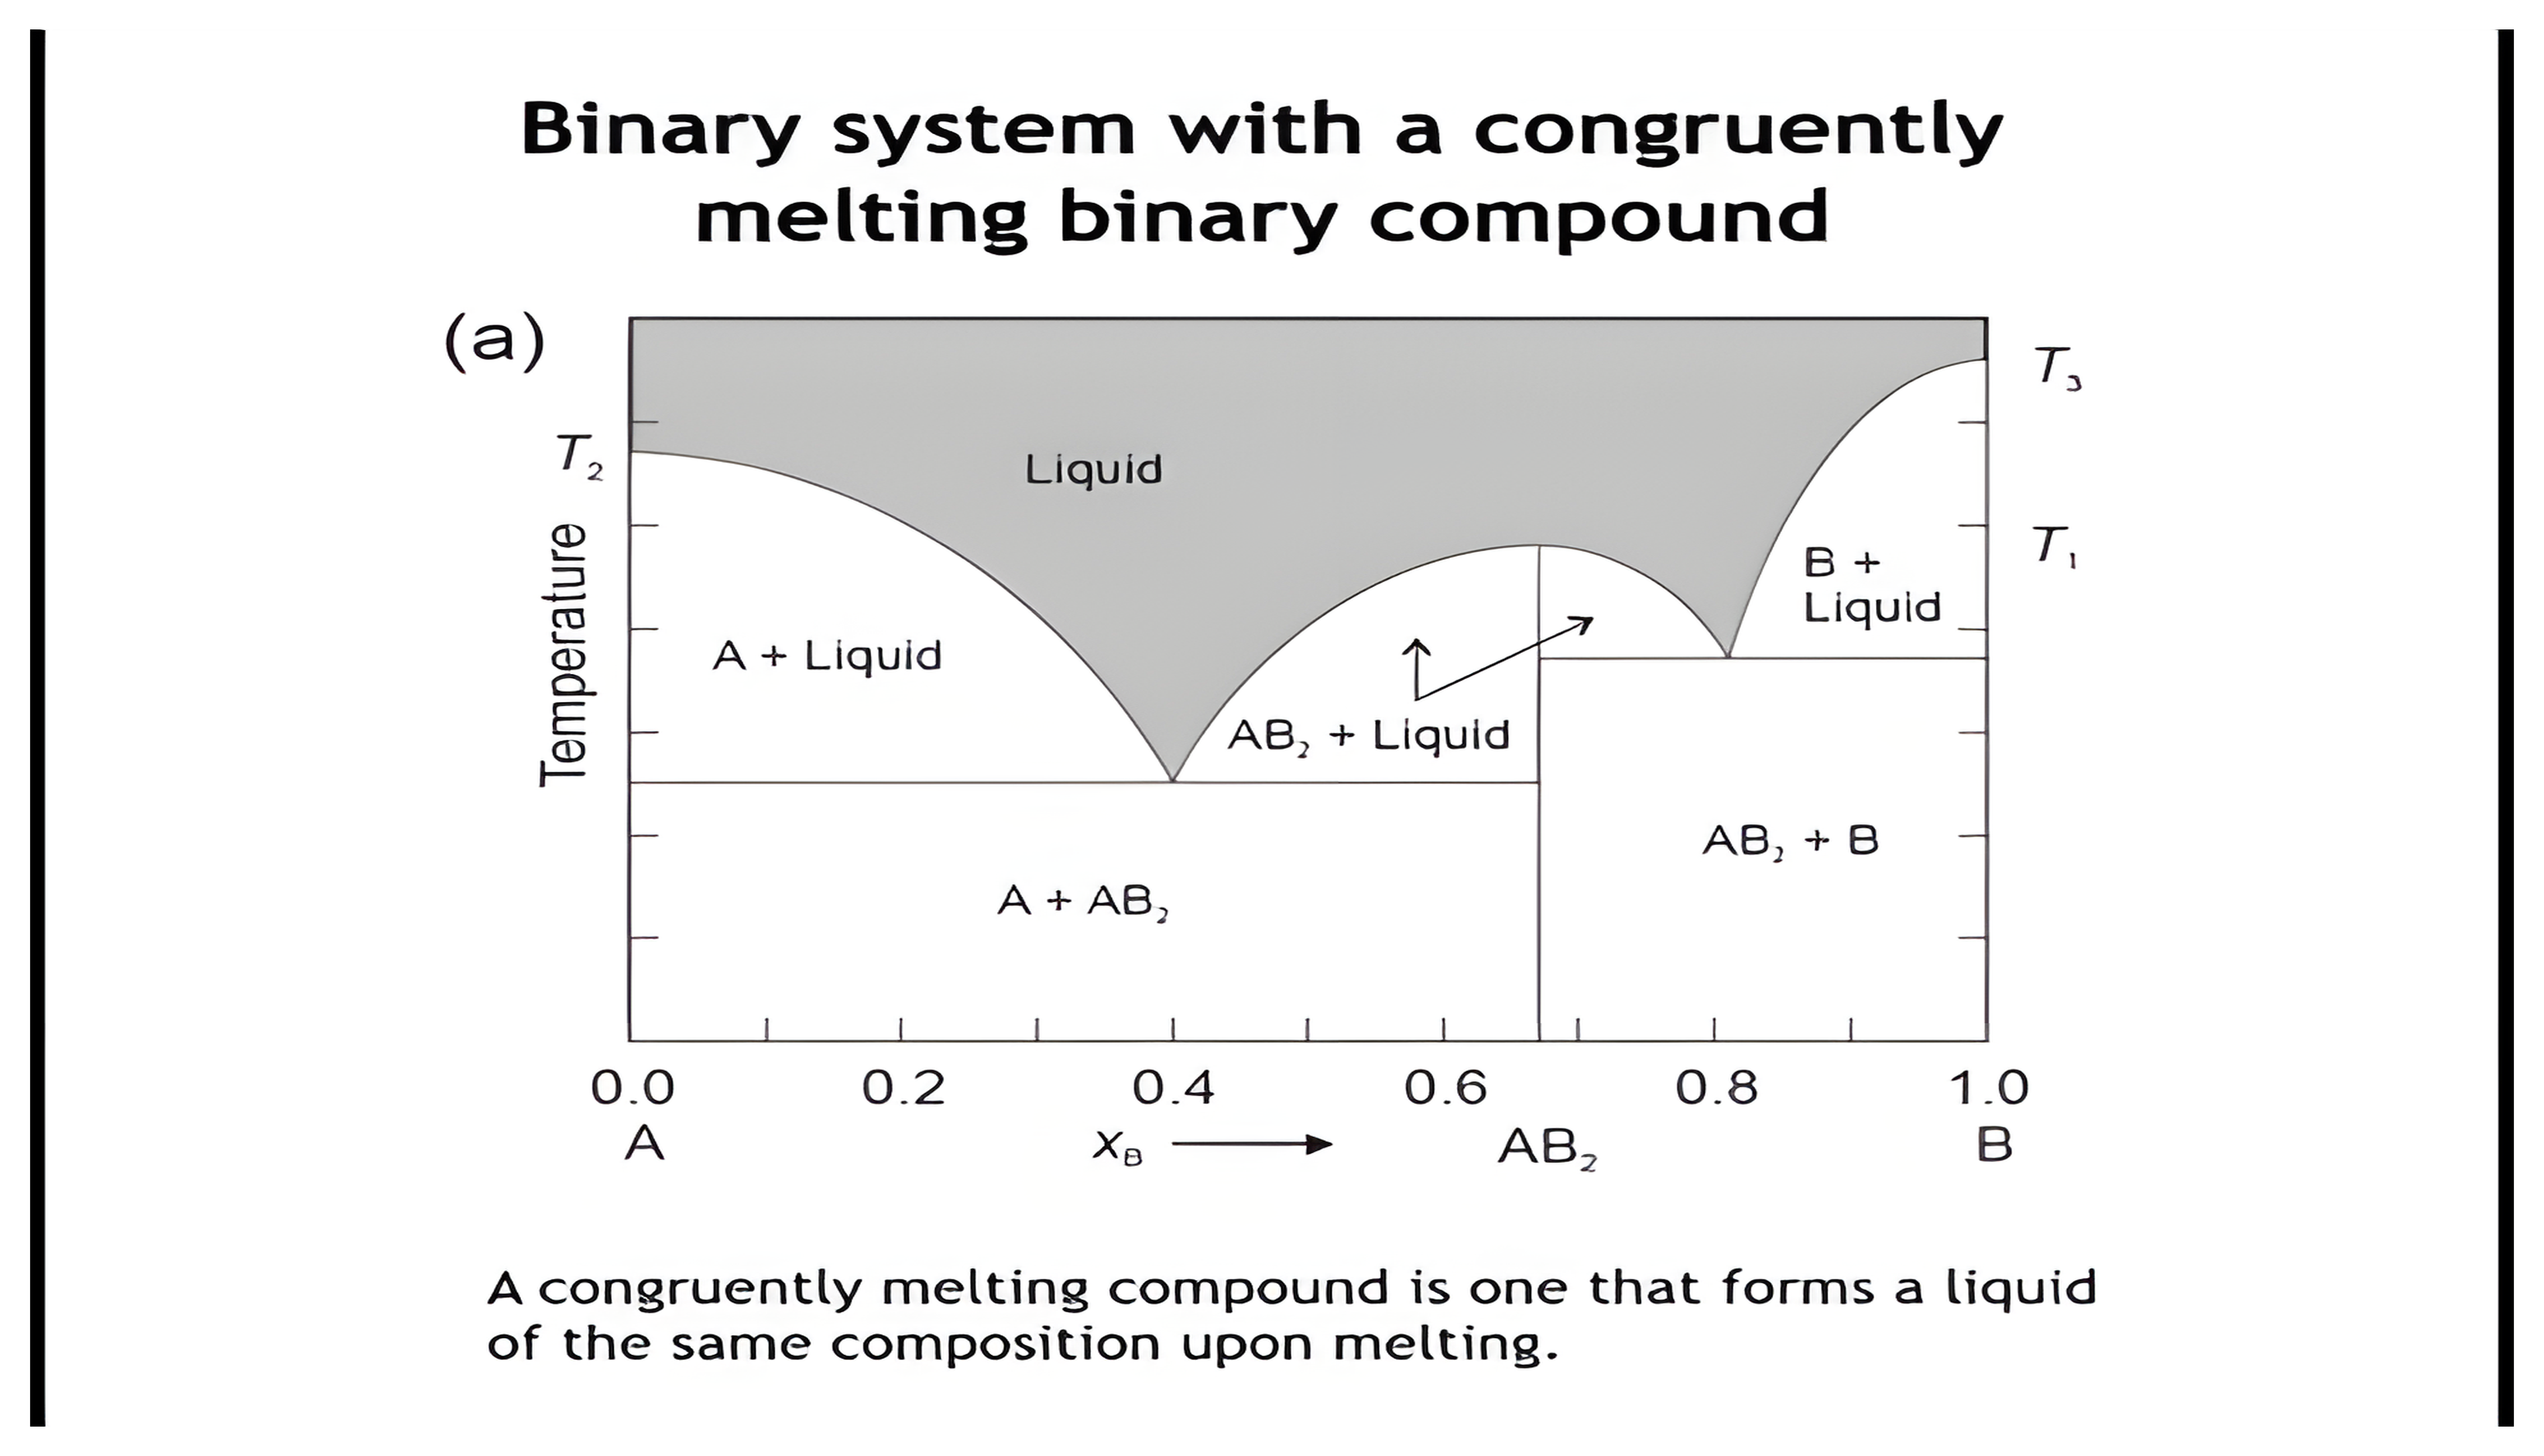
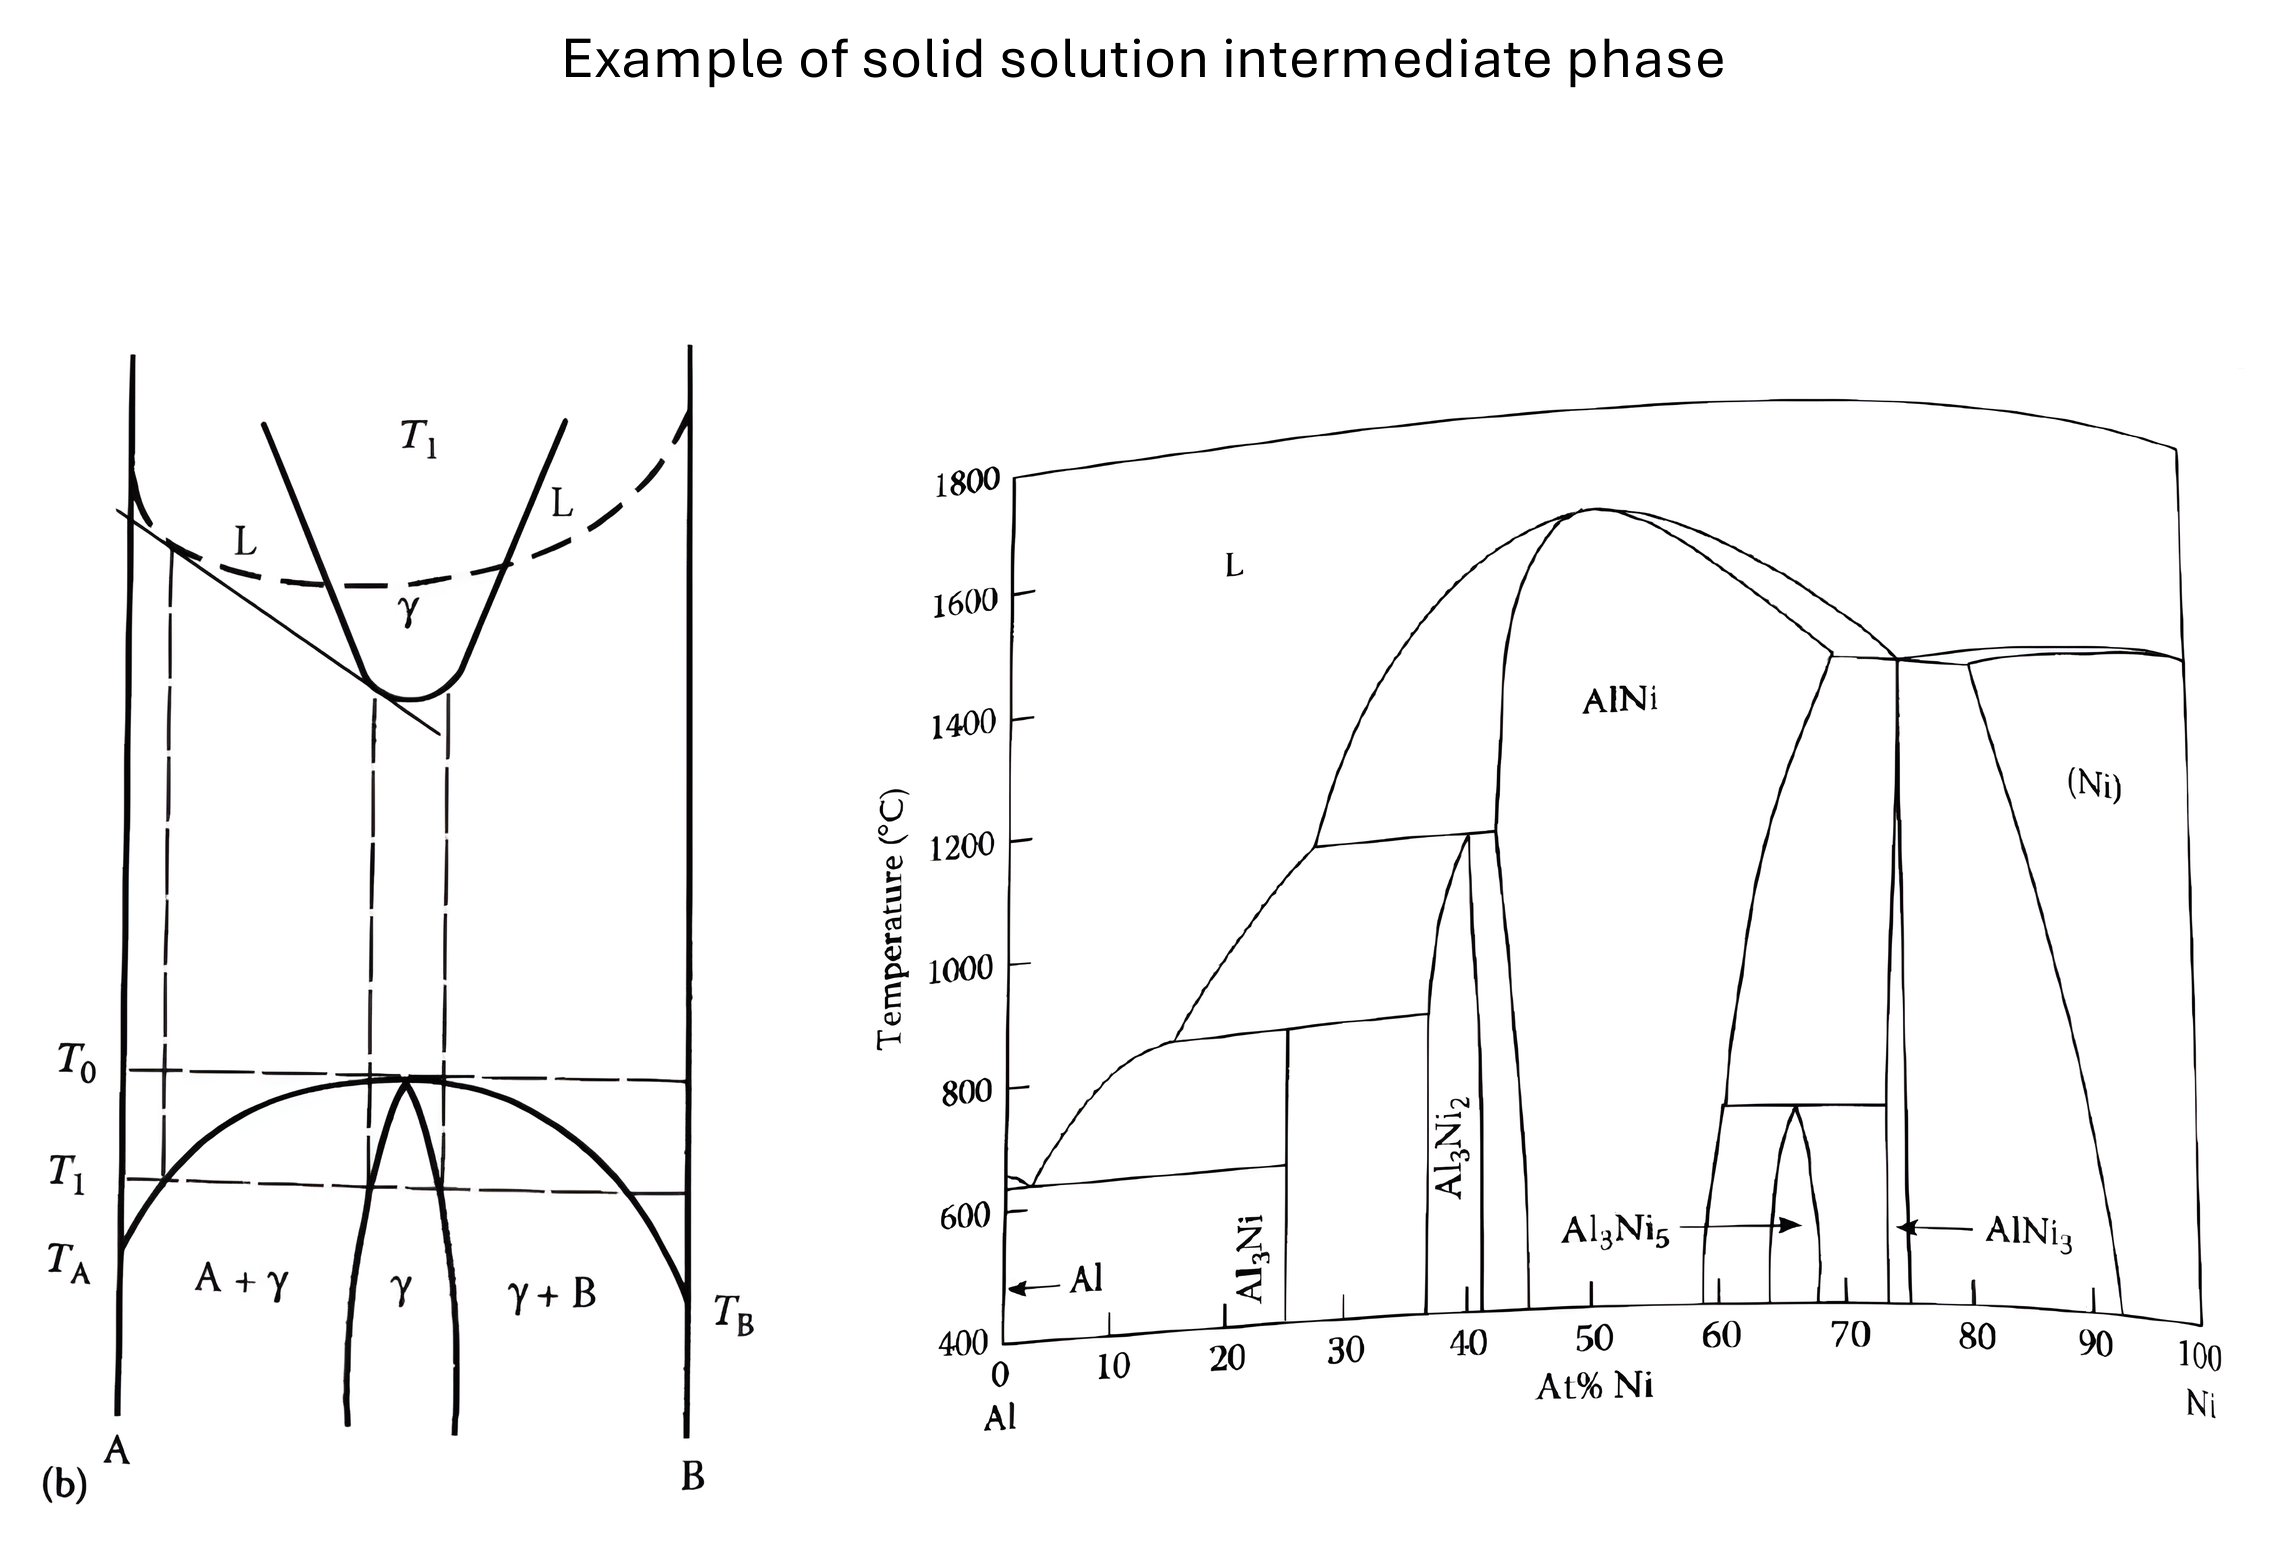
- Binary diagrams with intermediate compounds can be treated as two eutectic diagrams side-by-side.
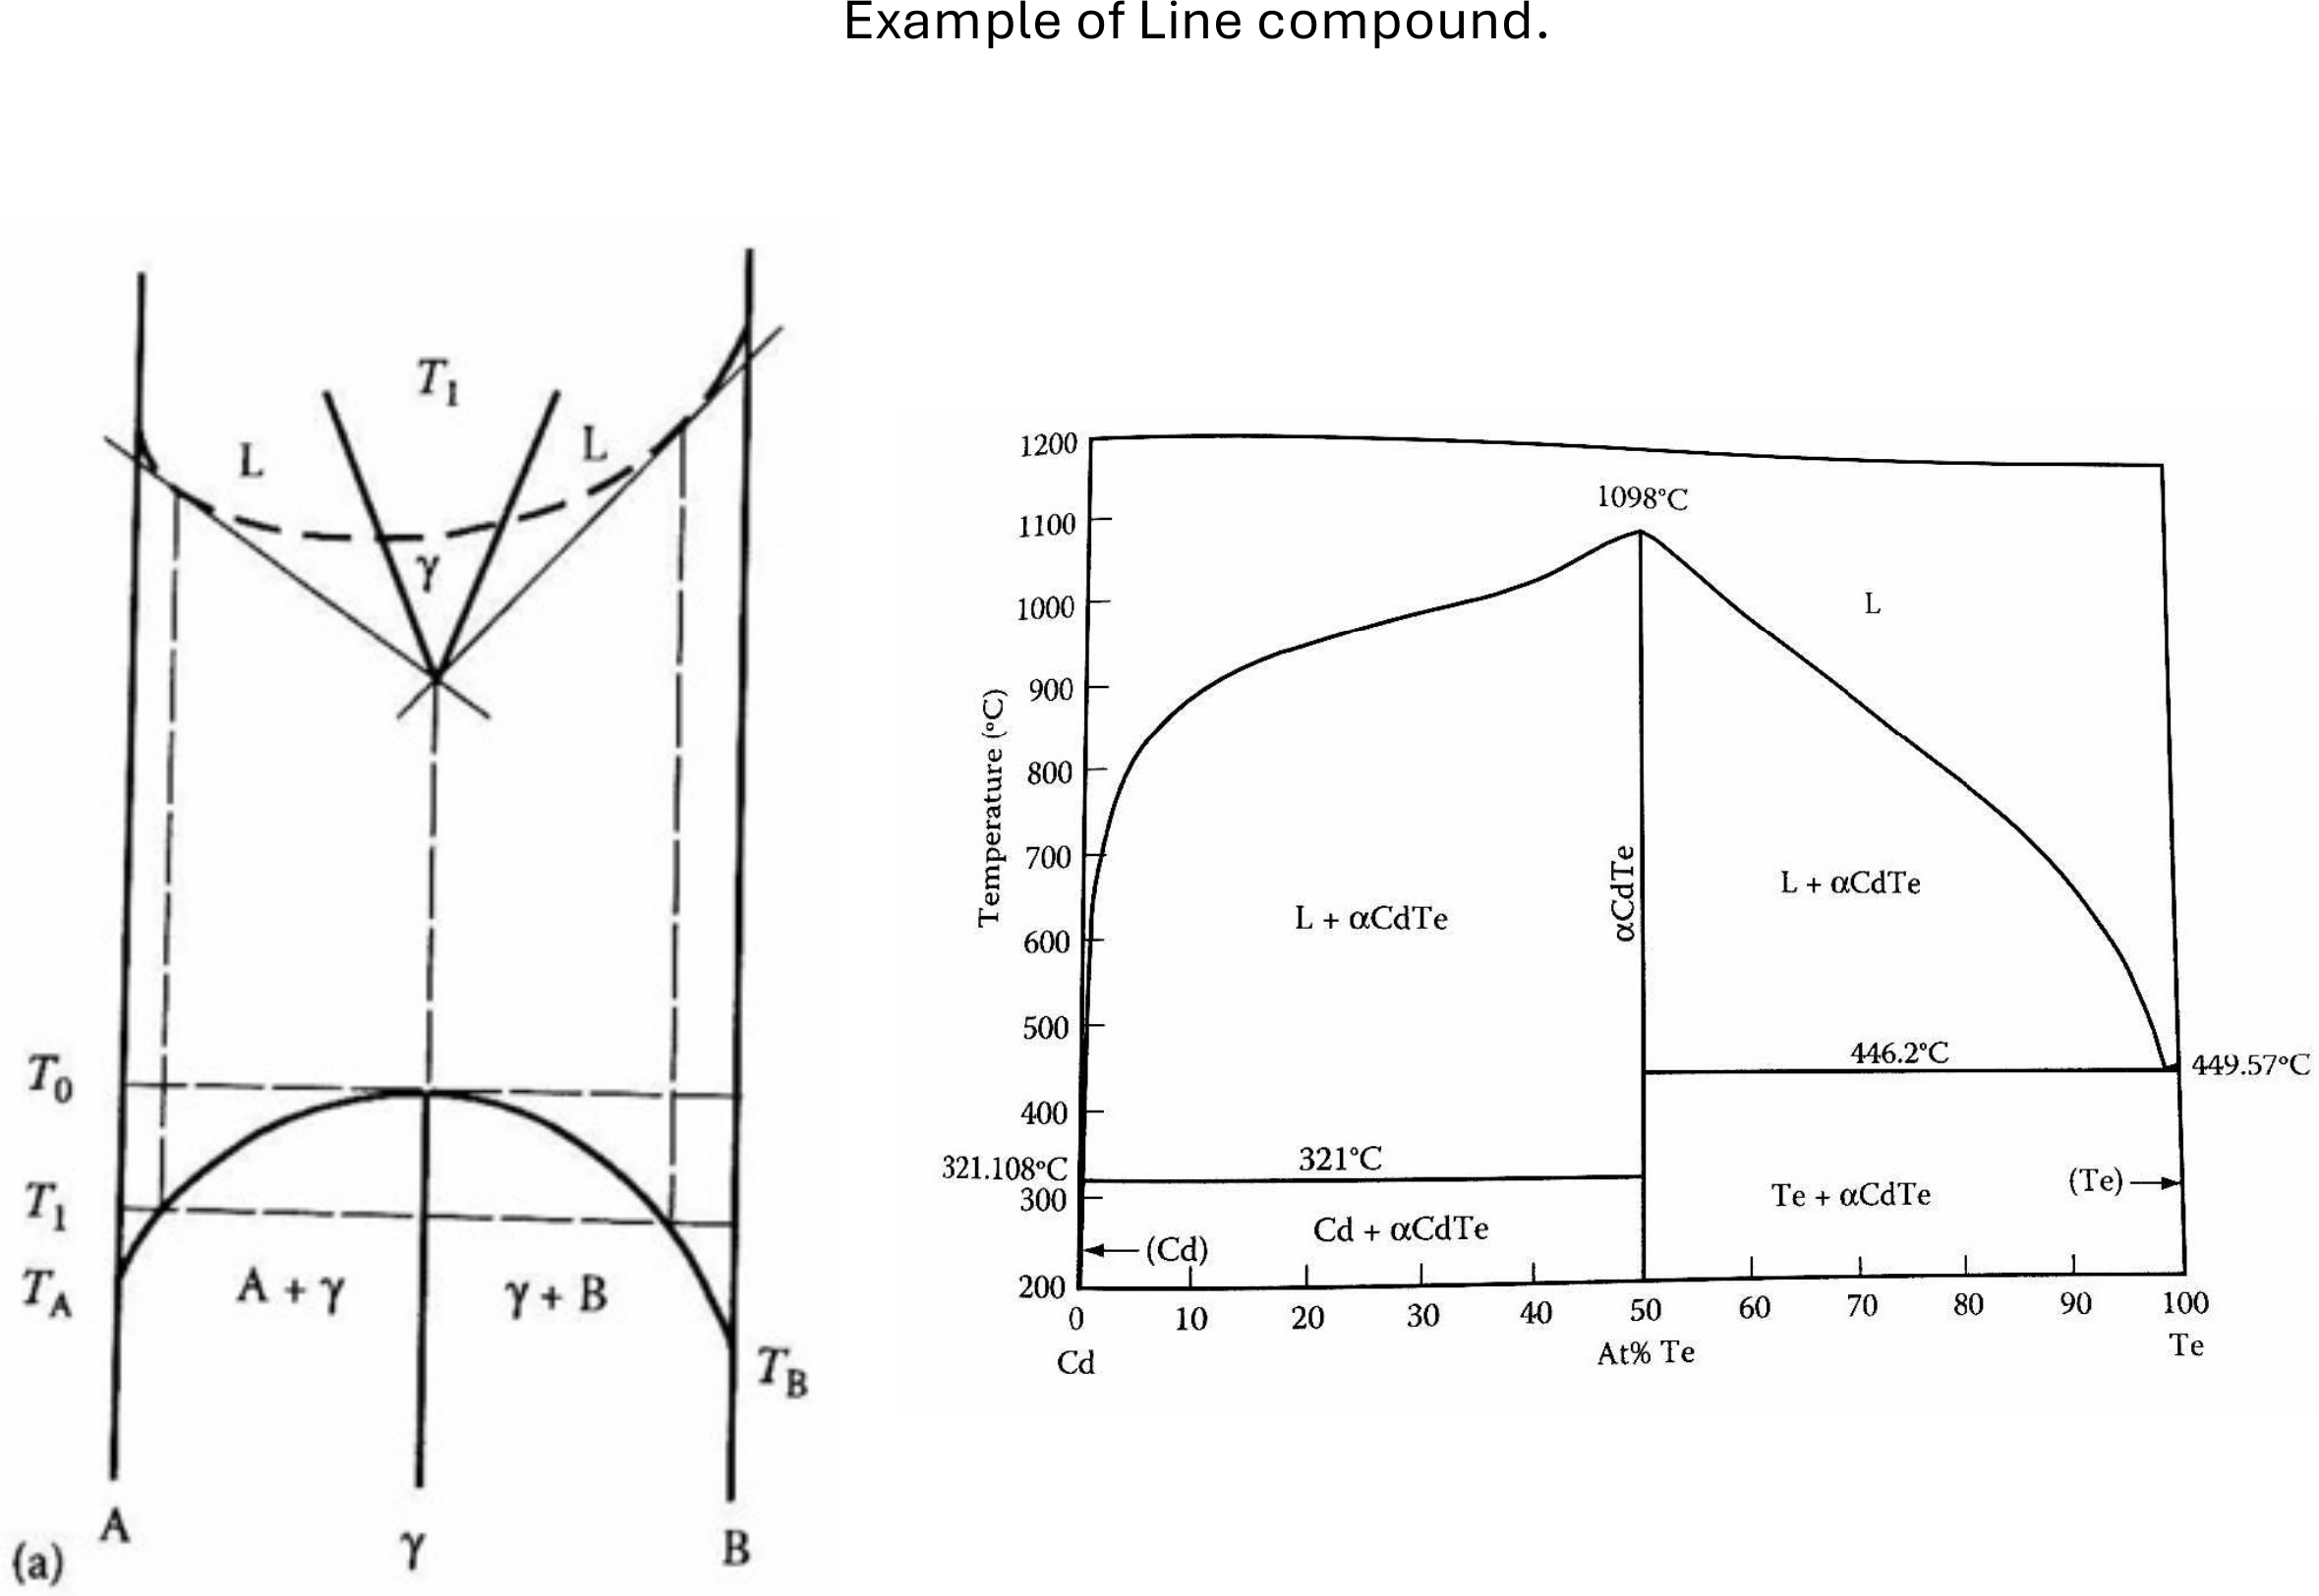
- Intermediate compounds may be line phases with fixed stoichiometry (e.g., AB₂).
- Congruently melting compounds: melt to a liquid of the same composition.
- Incongruently melting compounds: melt to a liquid of different composition + another solid → introduces the peritectic point.
- Crystal growth:
- Easier for congruently melting compounds.
- Incongruent compounds require controlled growth between eutectic and peritectic compositions, often followed by quenching.
- Real systems often include solid solutions as well as intermediate line phases.
Homework
4.2 Refer to the phase diagram depicted below. (a) State which four phases are stable at 100 °C. (b) What is the name given to the horizontal line separating region 2 from 1 and 3? (c) What are the approximate melting points of A, AB, and B? (d) What happens if you try and melt
4.3 Using the phase diagram of Figure 4.8: (a) State how you would attempt to prepare a solid polycrystalline sample of ZrW₂O₈. (b) State how you would attempt to grow single crystals of ZrW₂O₈.
4.4 In the system Al₂O₃–BaO, five phases stable above 1300 °C were identified: Al₂O₃, Al₁₂BaO₁₉, Al₂BaO₄, Al₂Ba₃O₆, and BaO. Each was found to melt congruently at 2072 °C, 1900 °C, 1811 °C, 1616 °C, and 1918 °C, respectively. Eutectics form at xBaO = 0.11, 0.32,
4.5 Perovskite chemists searching in the CaO–TiO₂ system initially found four phases stable above 1300 °C: CaO, Ca₃Ti₂O₇, CaTiO₃, and TiO₂. CaO, CaTiO₃, and TiO₂ were reported to melt congruently at 2600 °C, 1970 °C, and 1830 °C and Ca₃Ti₂O₇ to melt incongruently at 1750 °C. Eutectics were reported at xTiO₂ = 0.29 and 0.76 with melting points of 1695 °C and 1460 °C. Sketch and fully label a phase diagram for this system.
Ternary Phase Diagrams
Learning Objectives
By the end of this lecture, you should be able to:
- Explain the difference between binary and ternary phase diagrams.
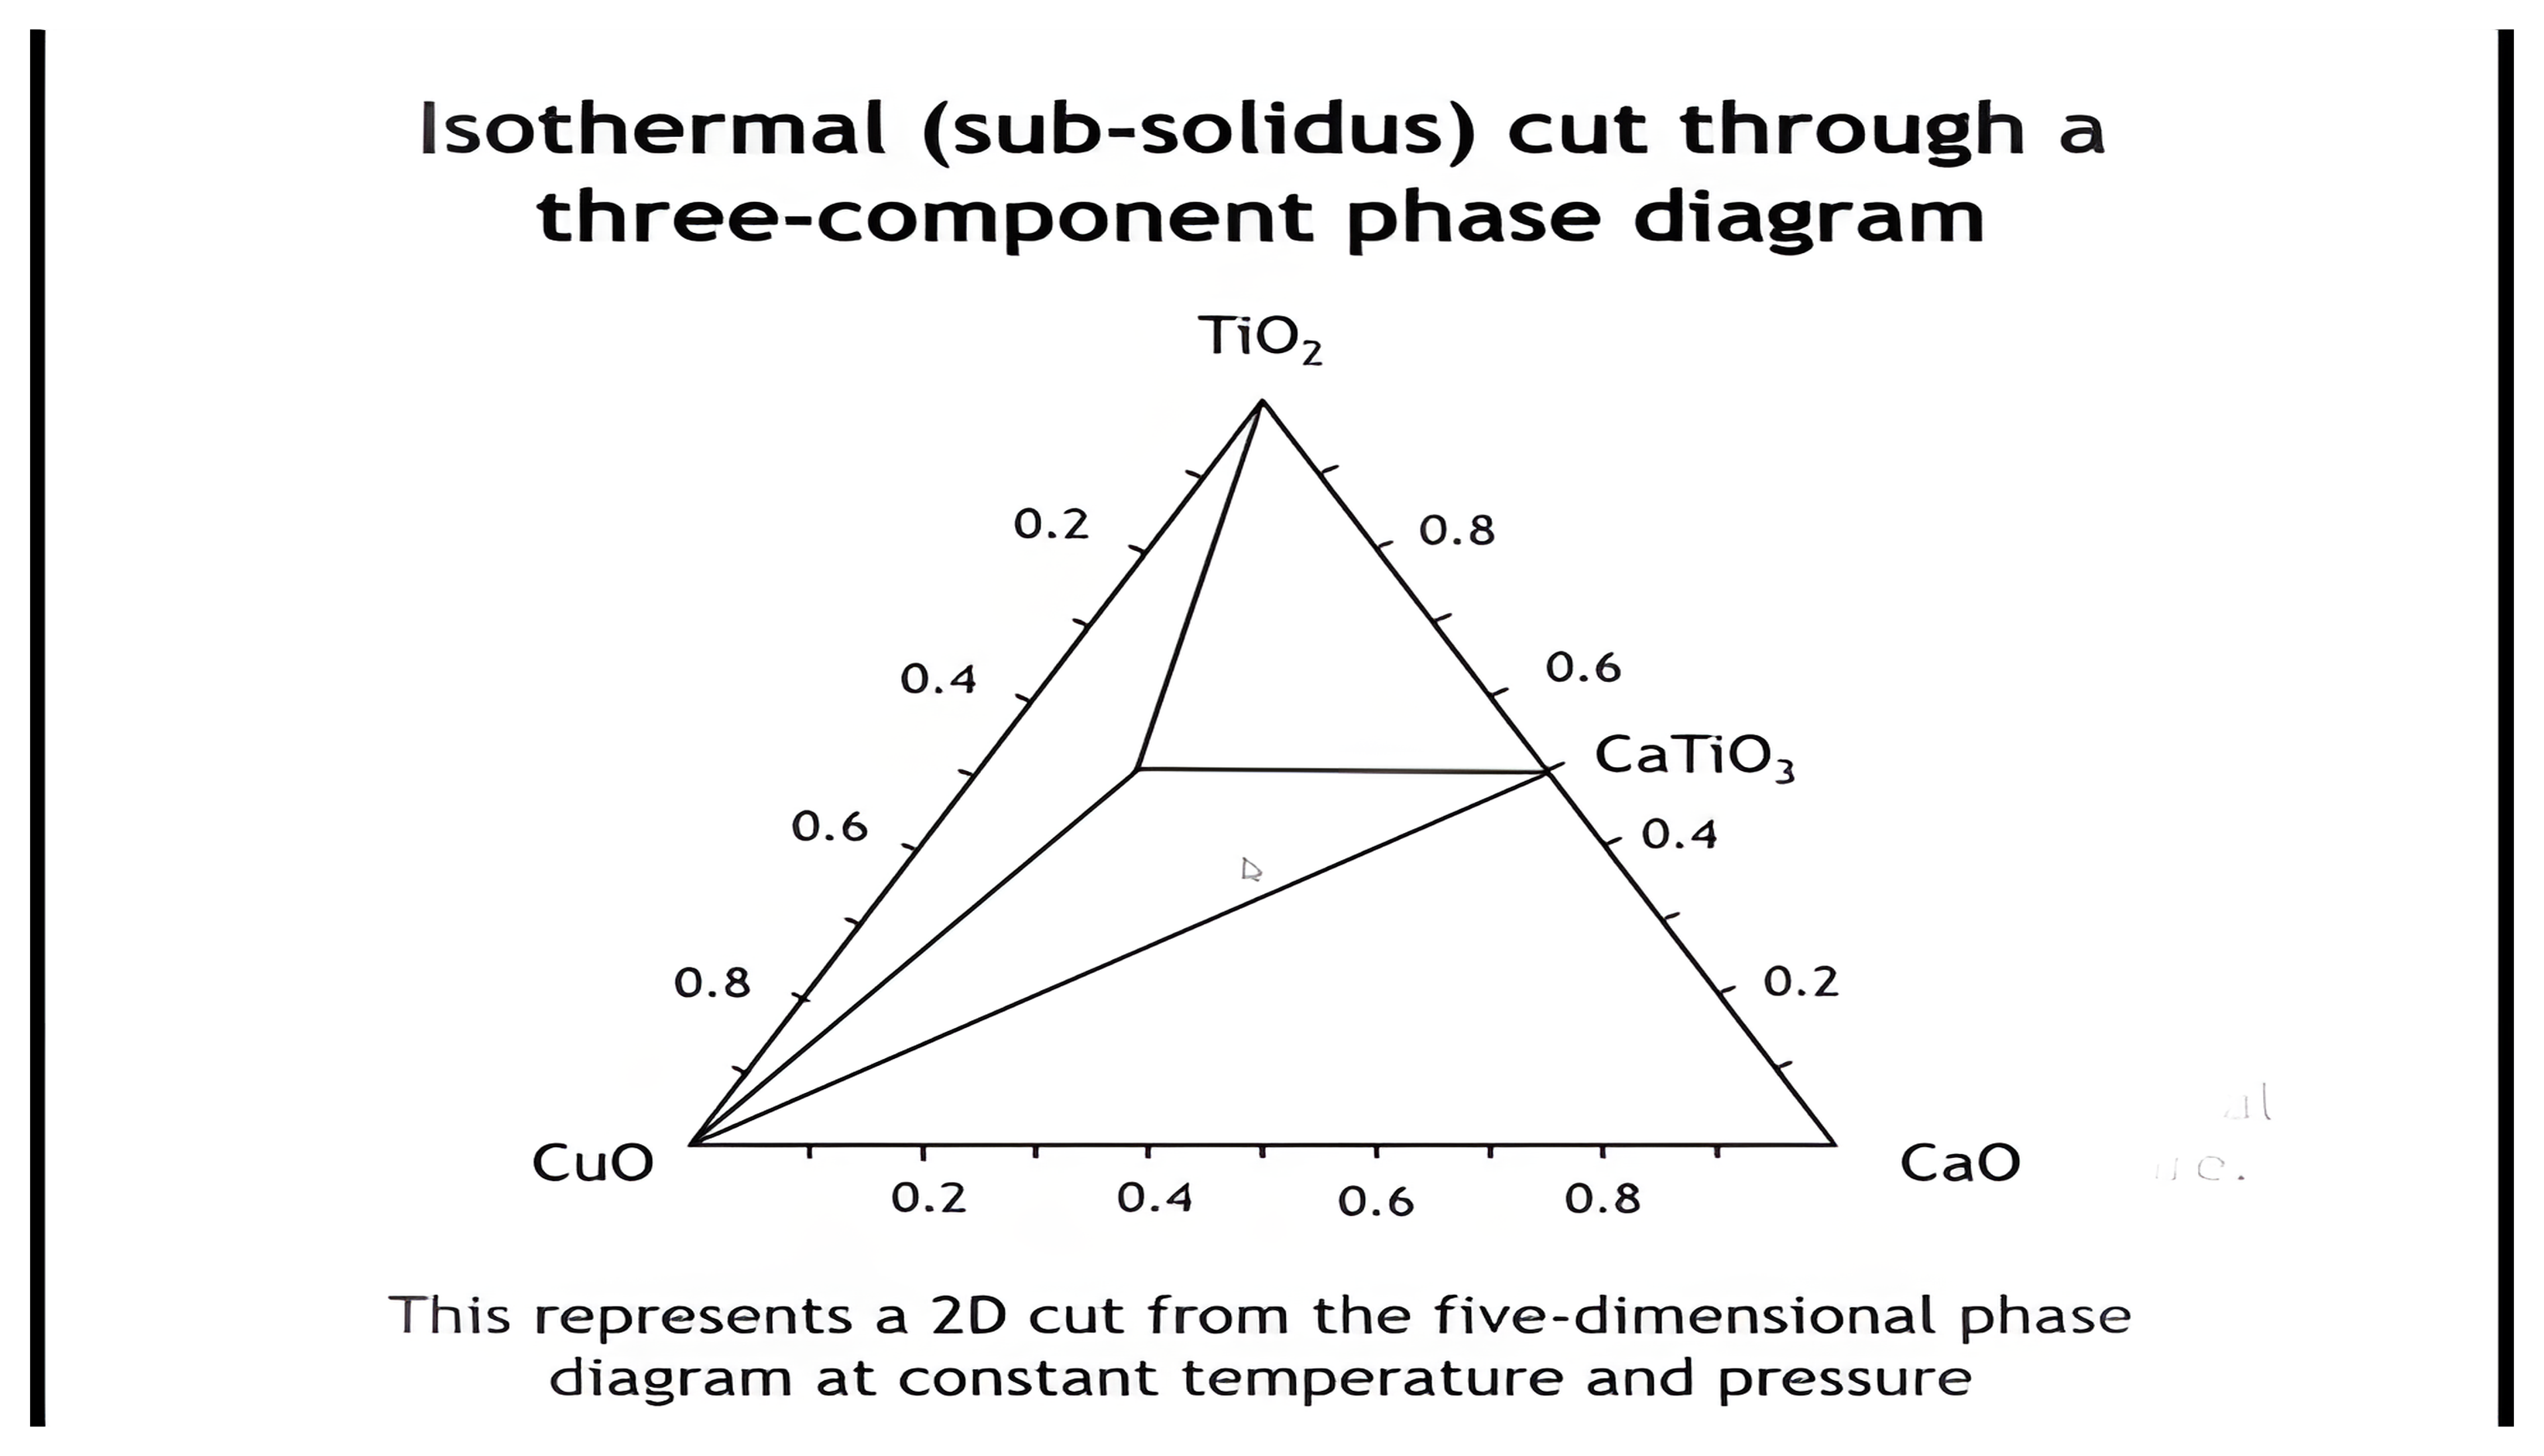
- Describe how ternary phase diagrams are represented and why simplifications (isothermal cuts) are used.
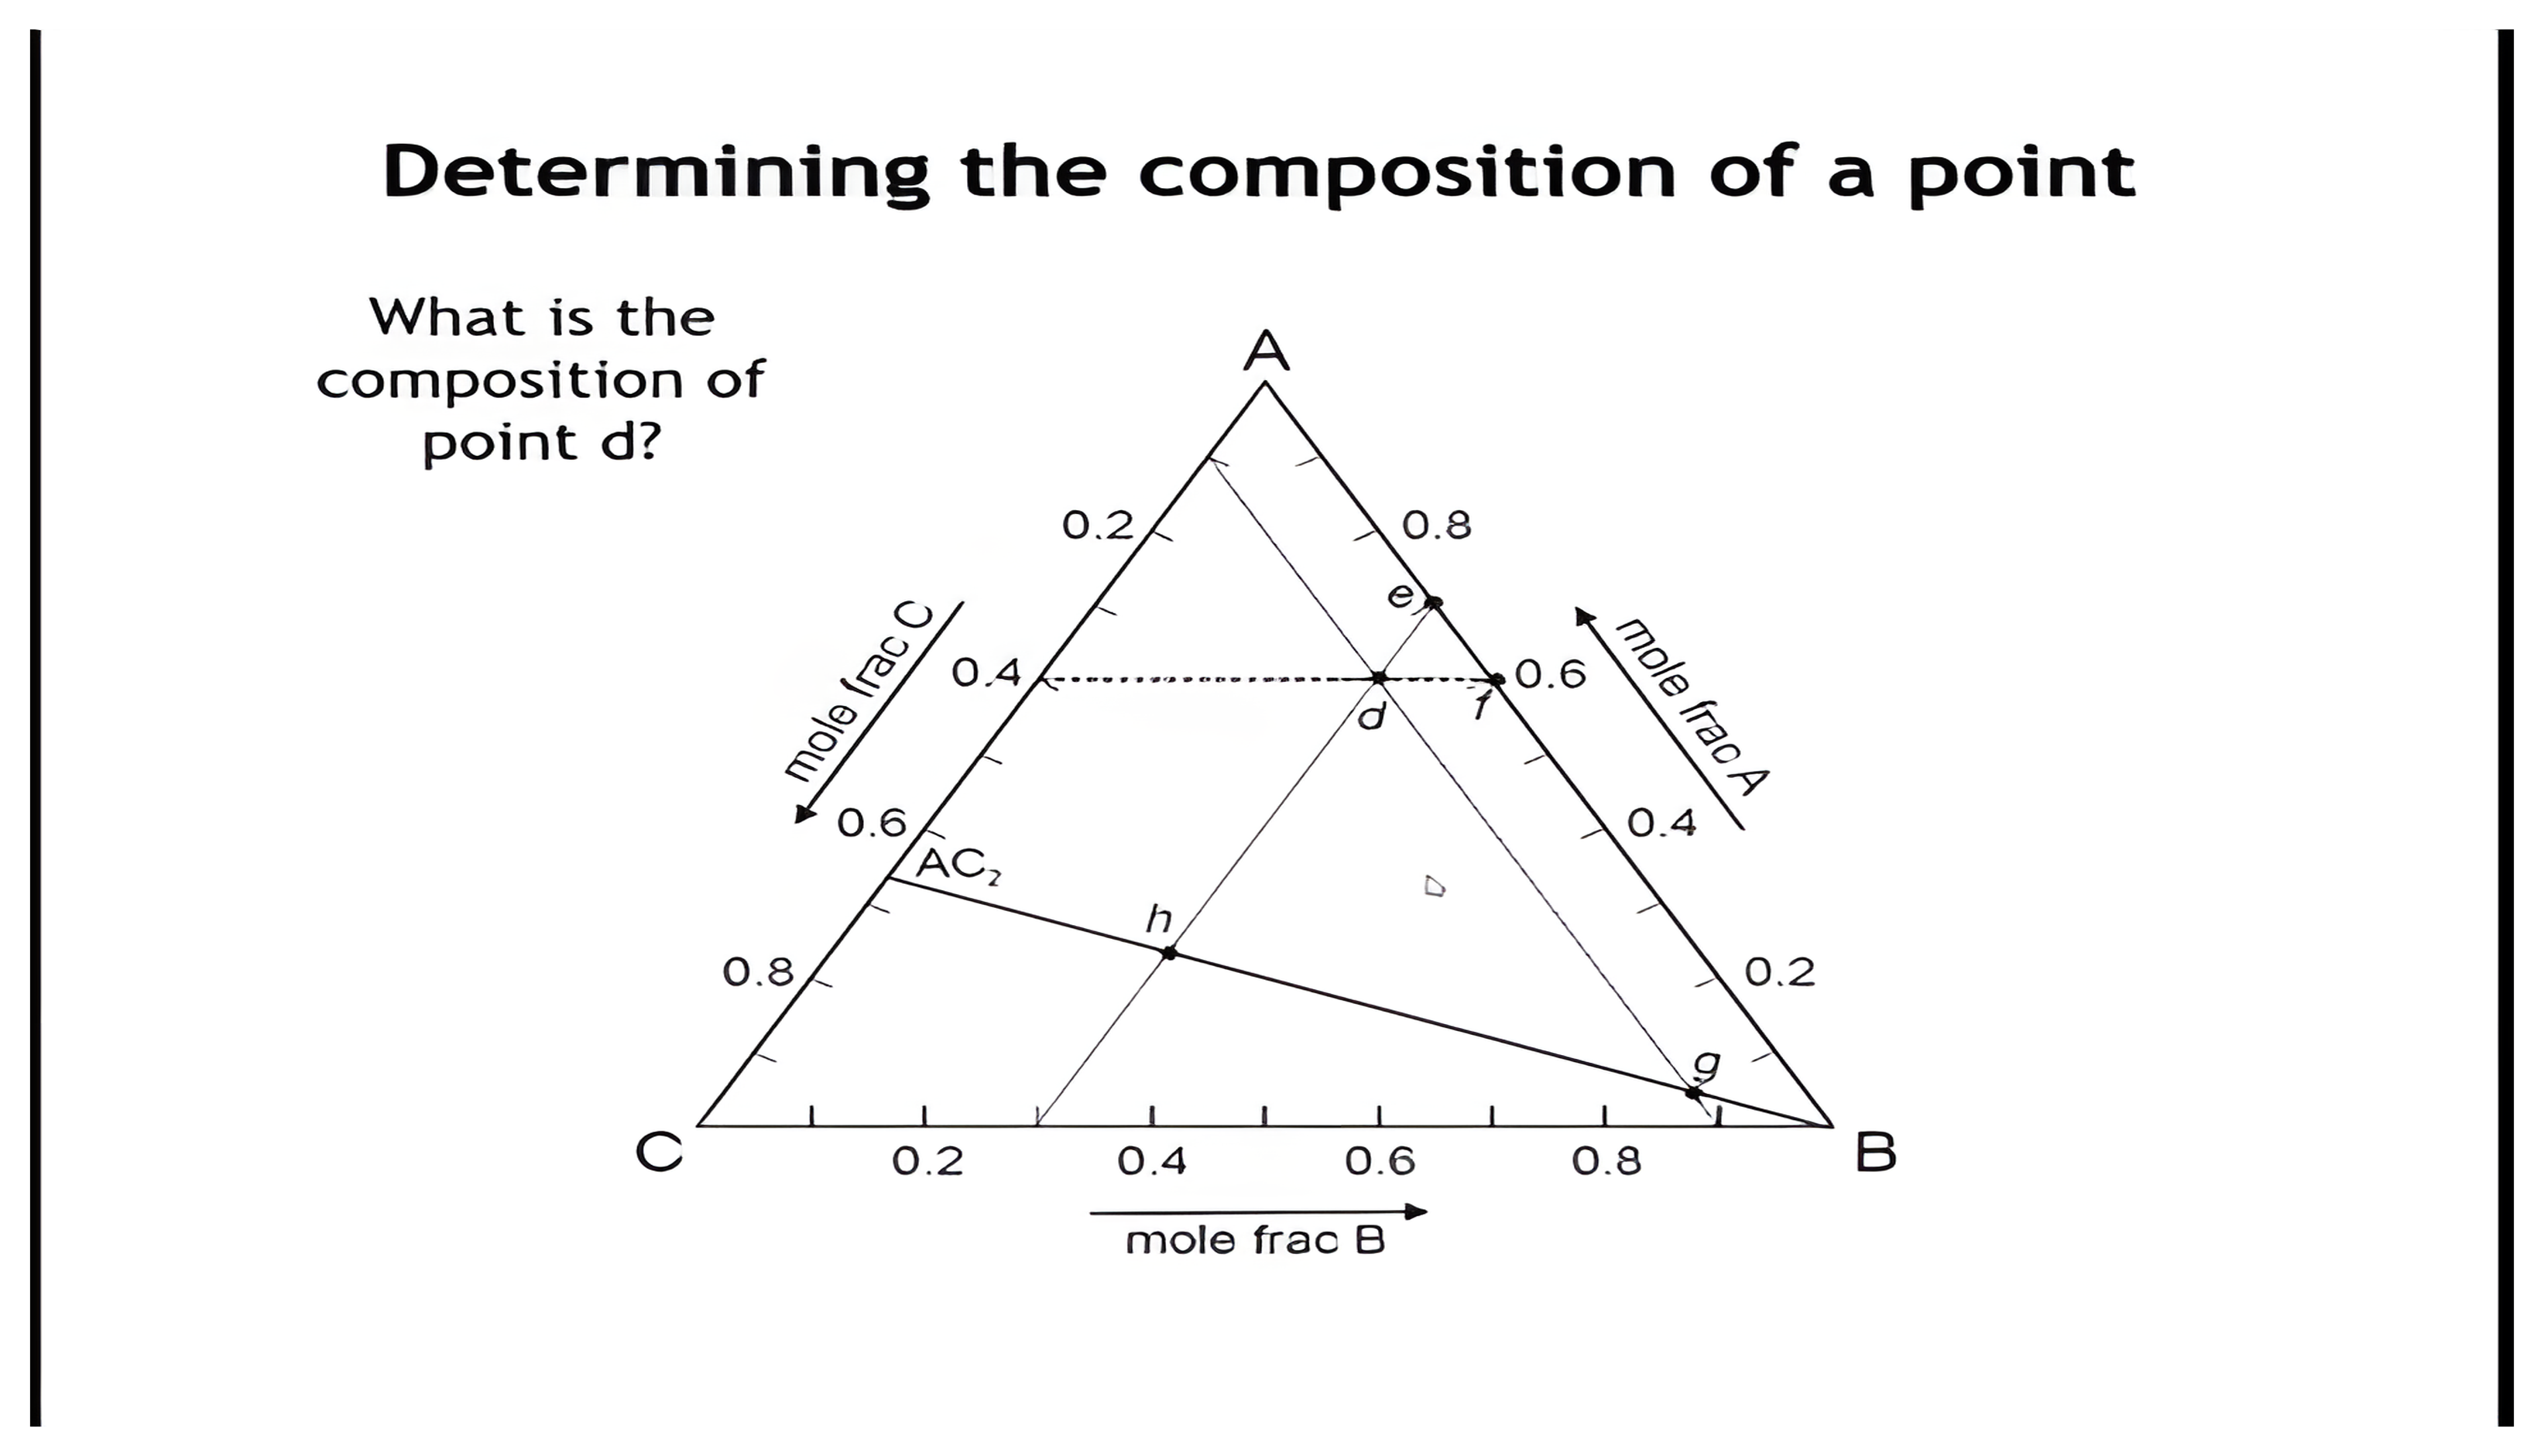
- Locate a composition within a ternary diagram using the line/triangle method.
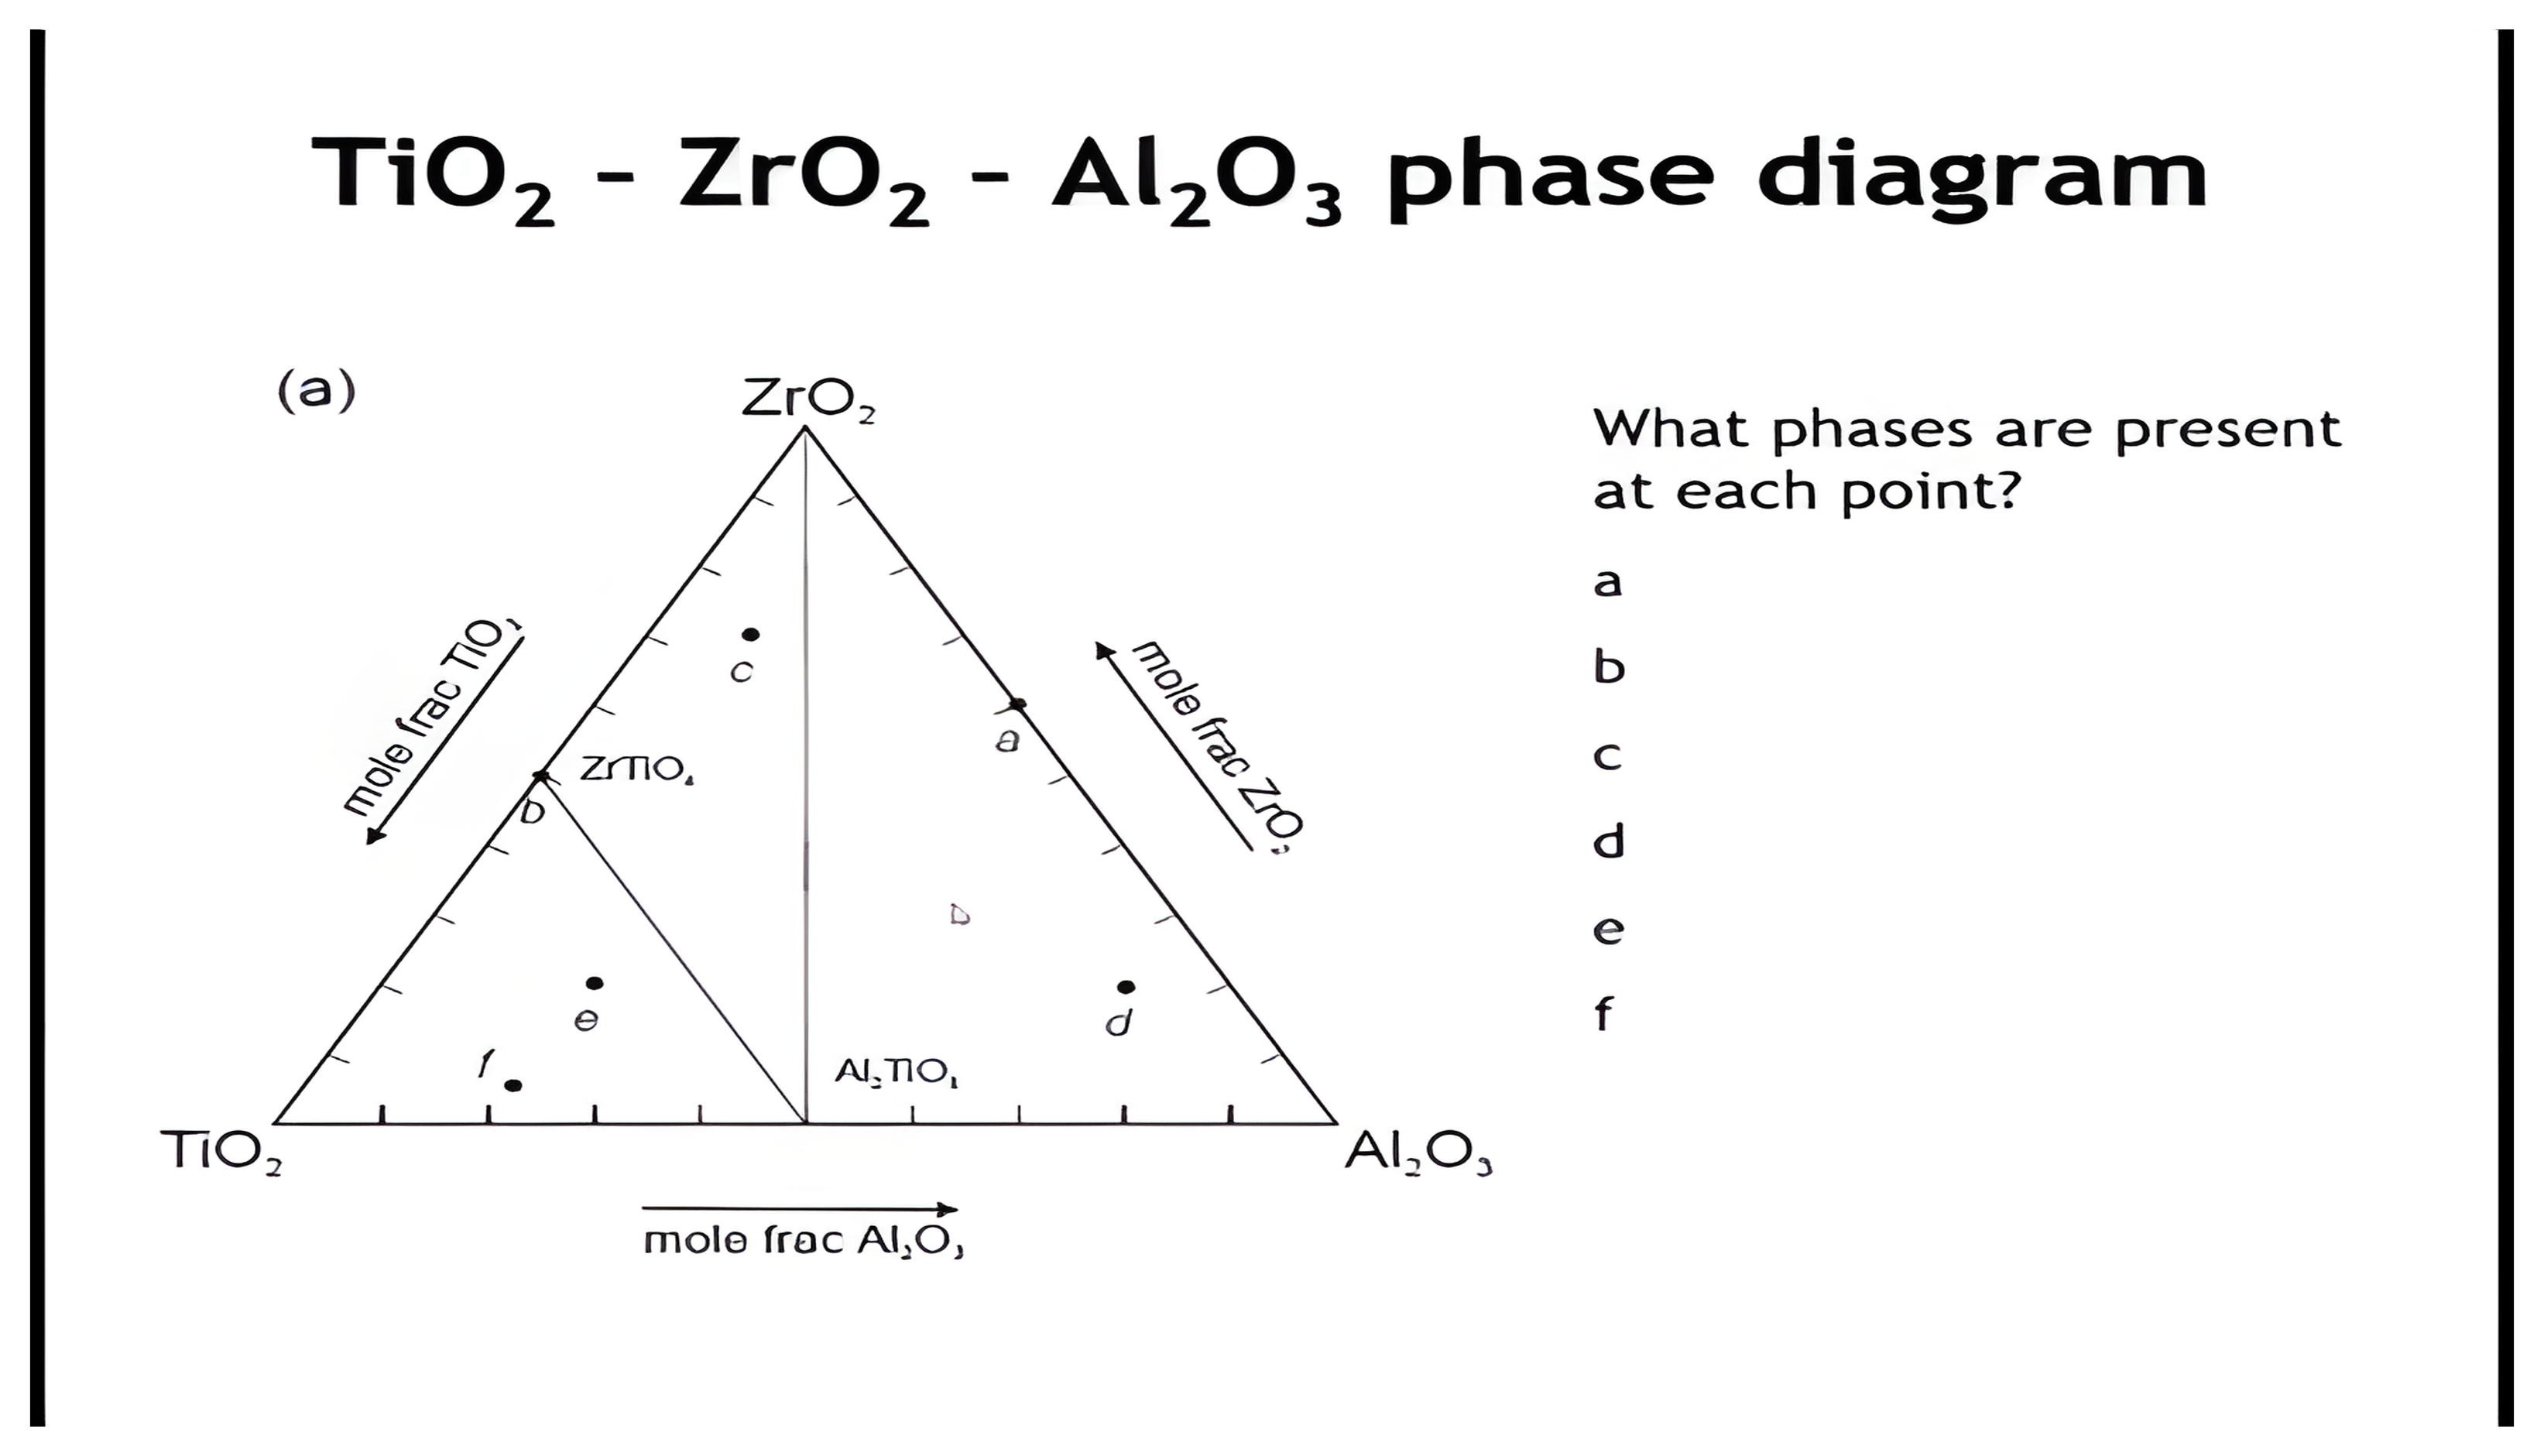
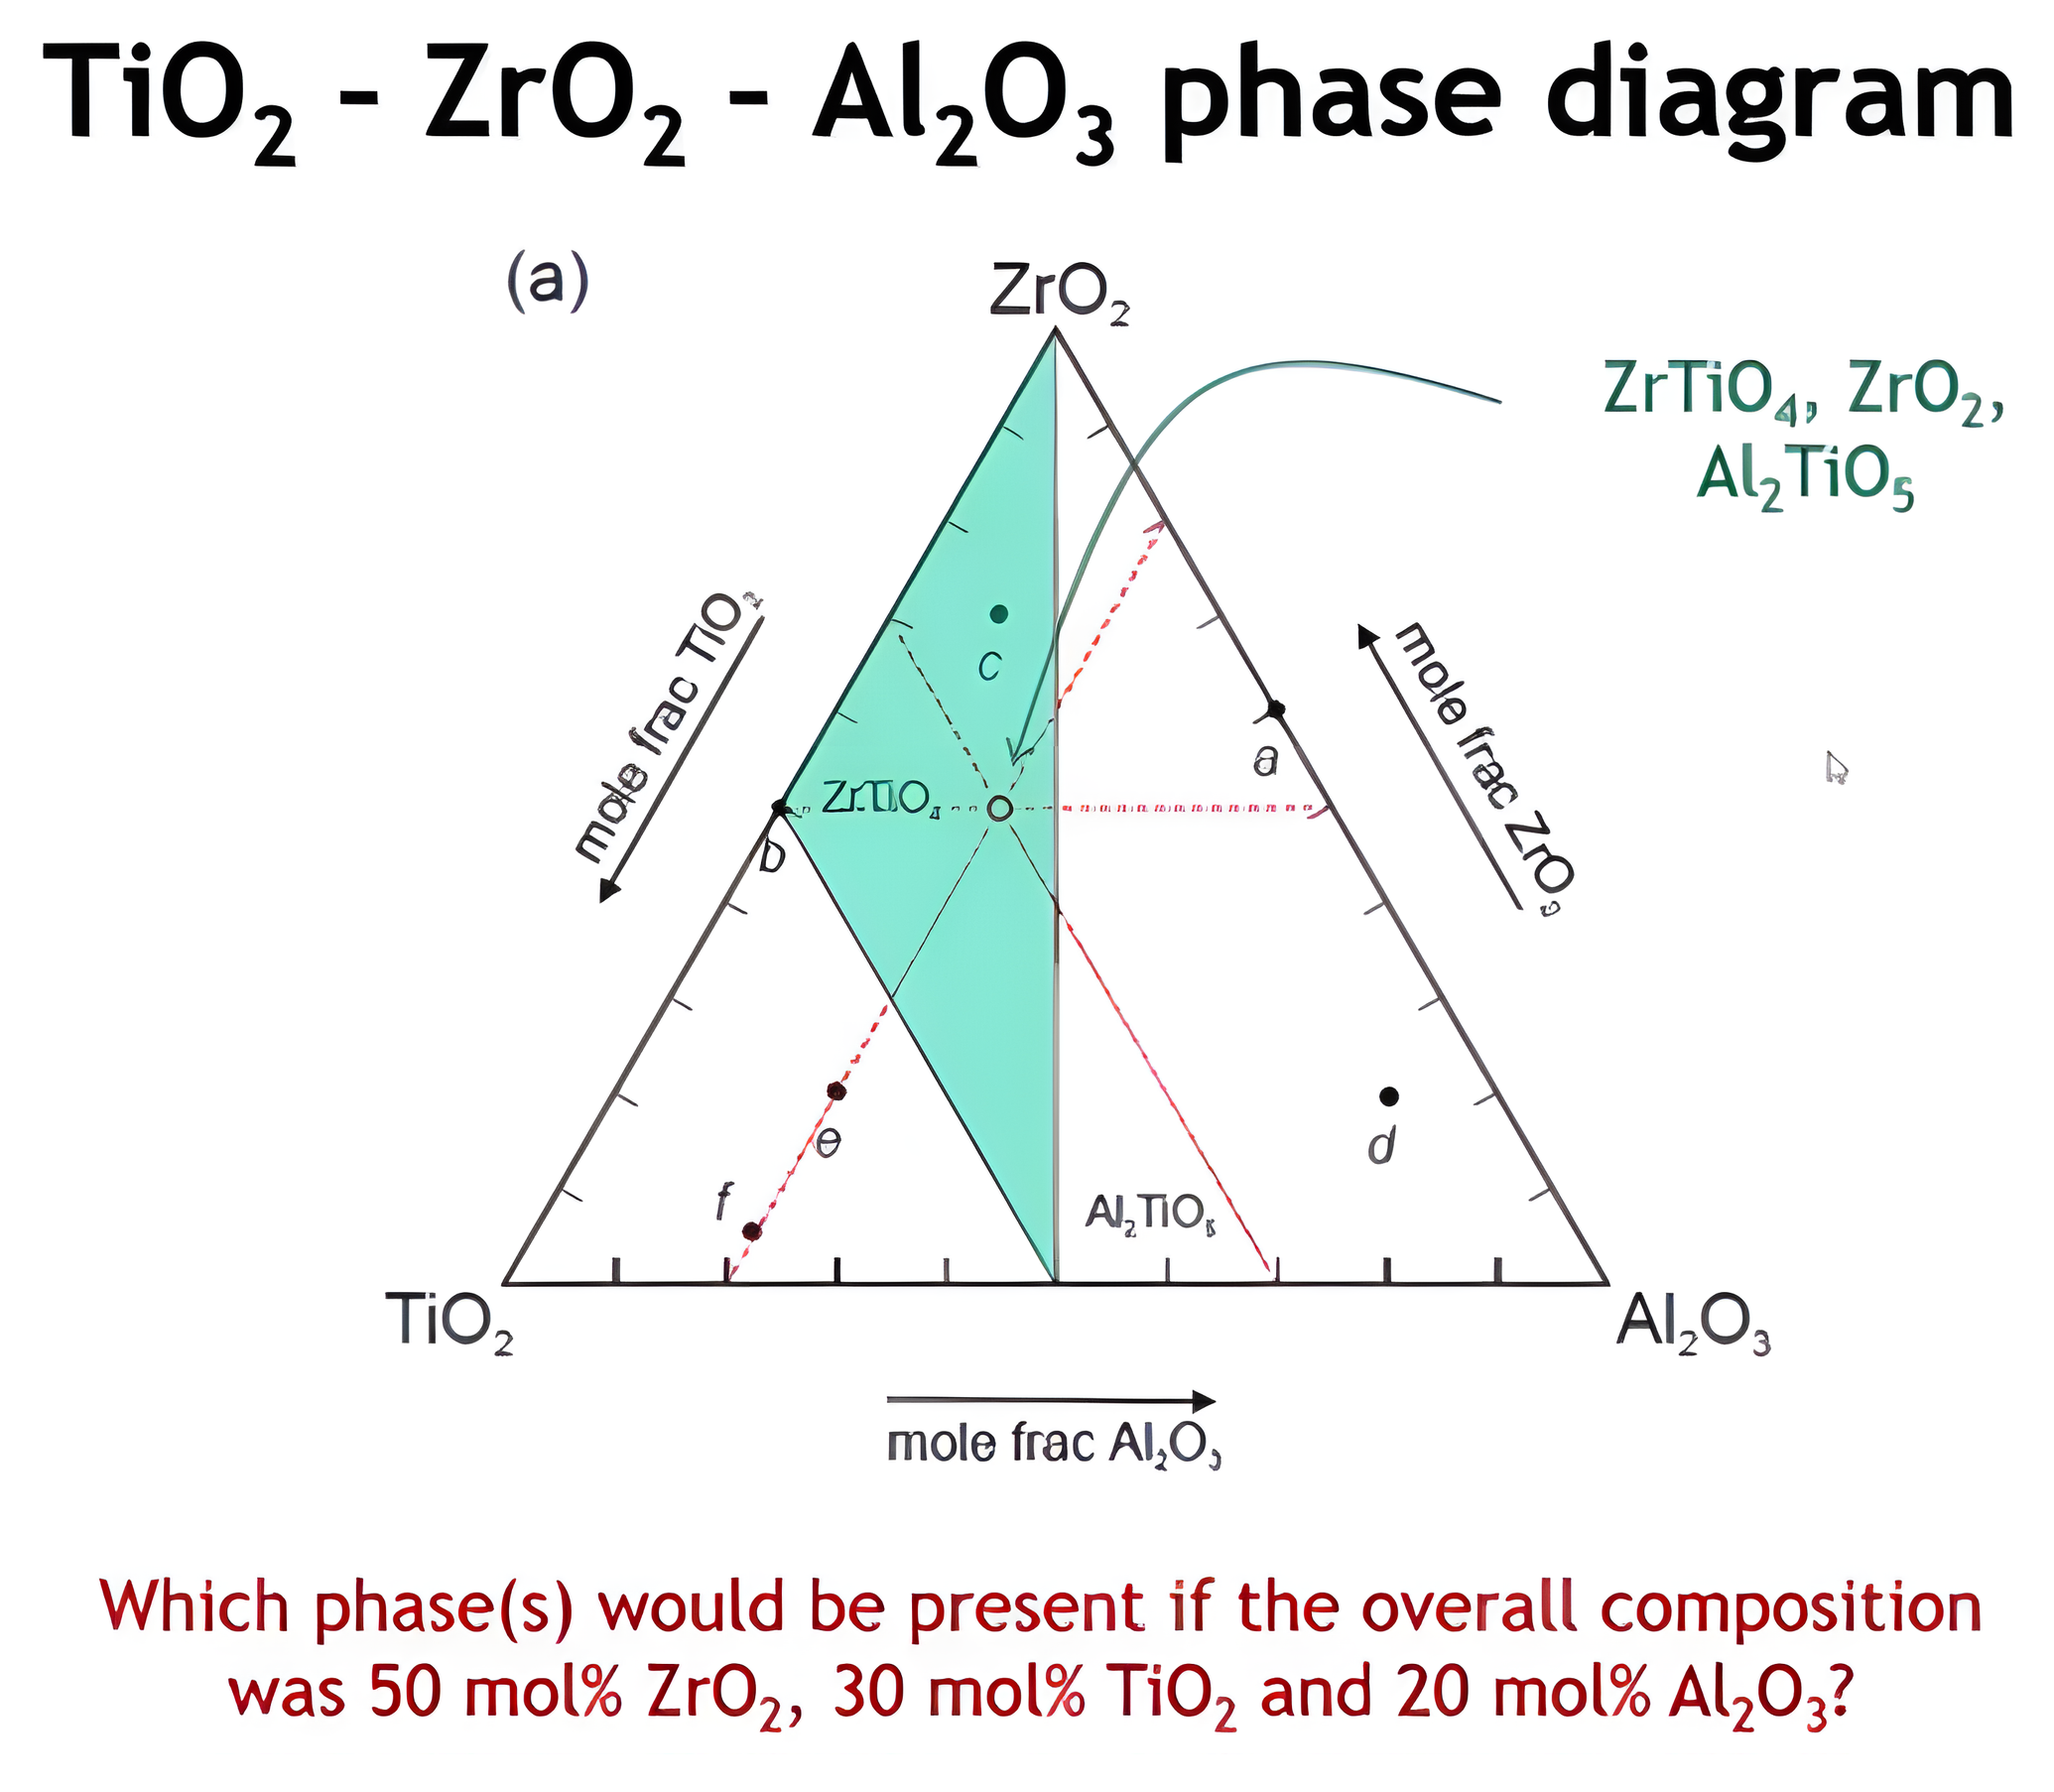
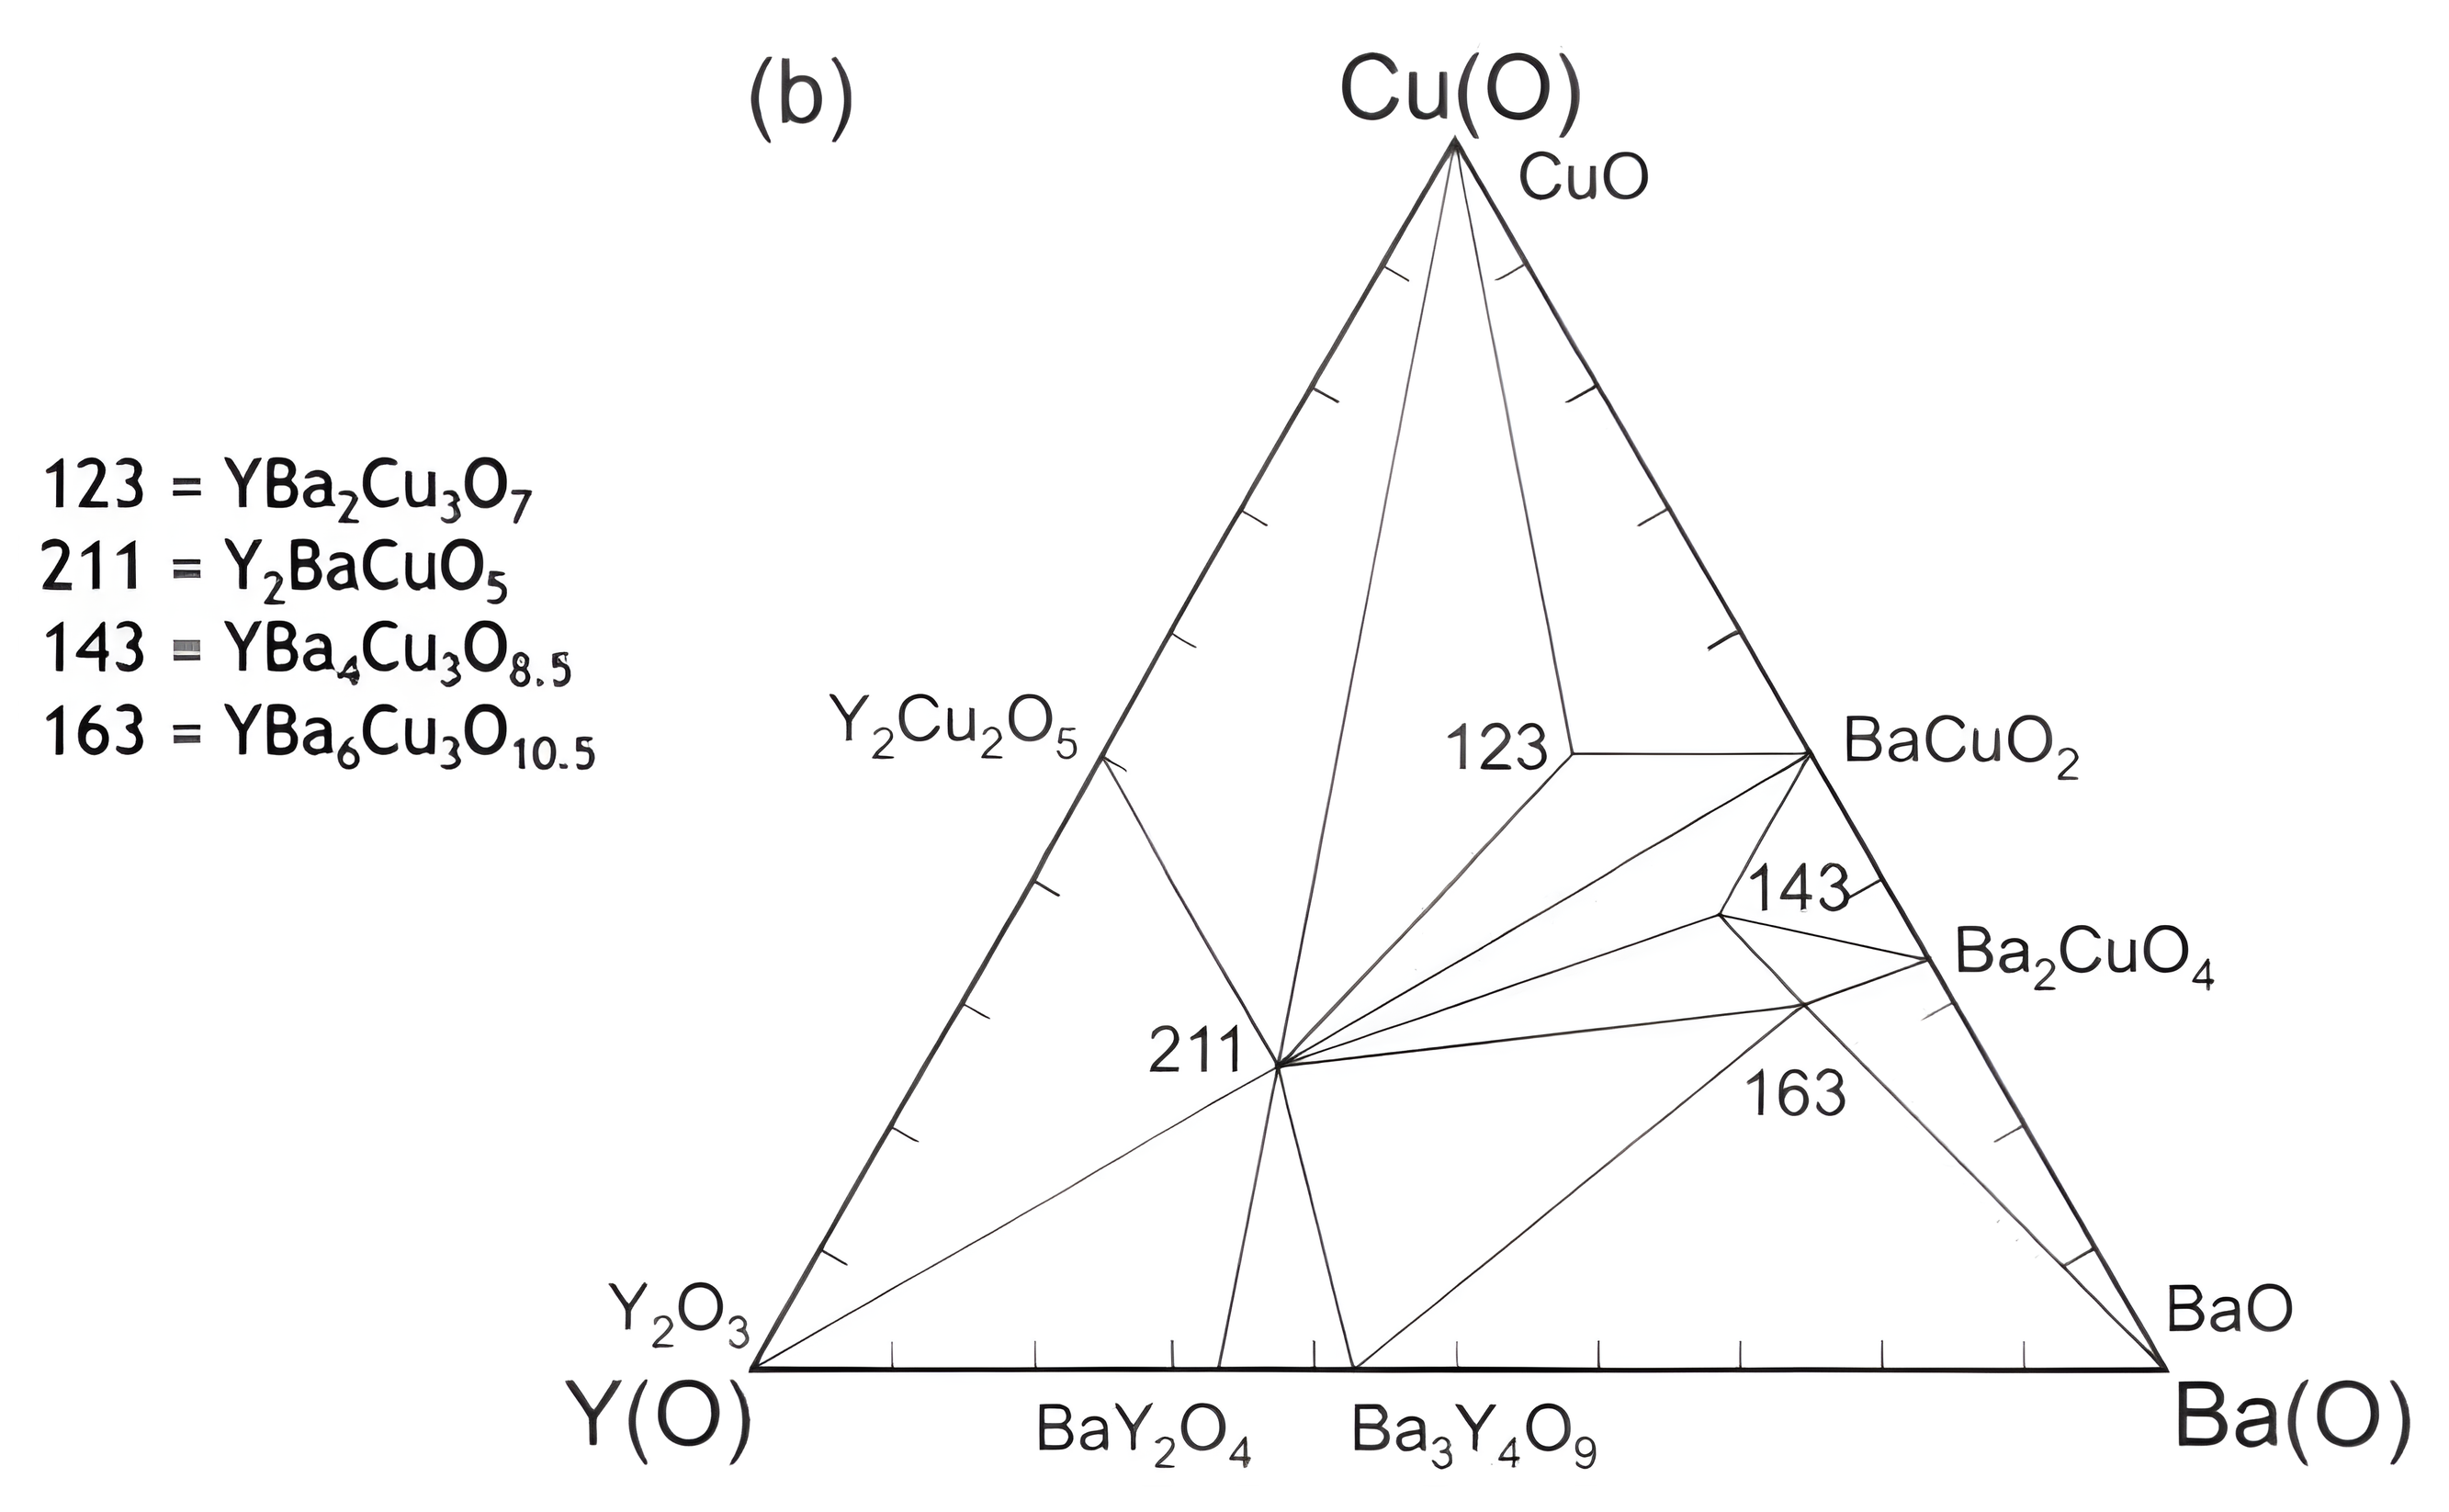
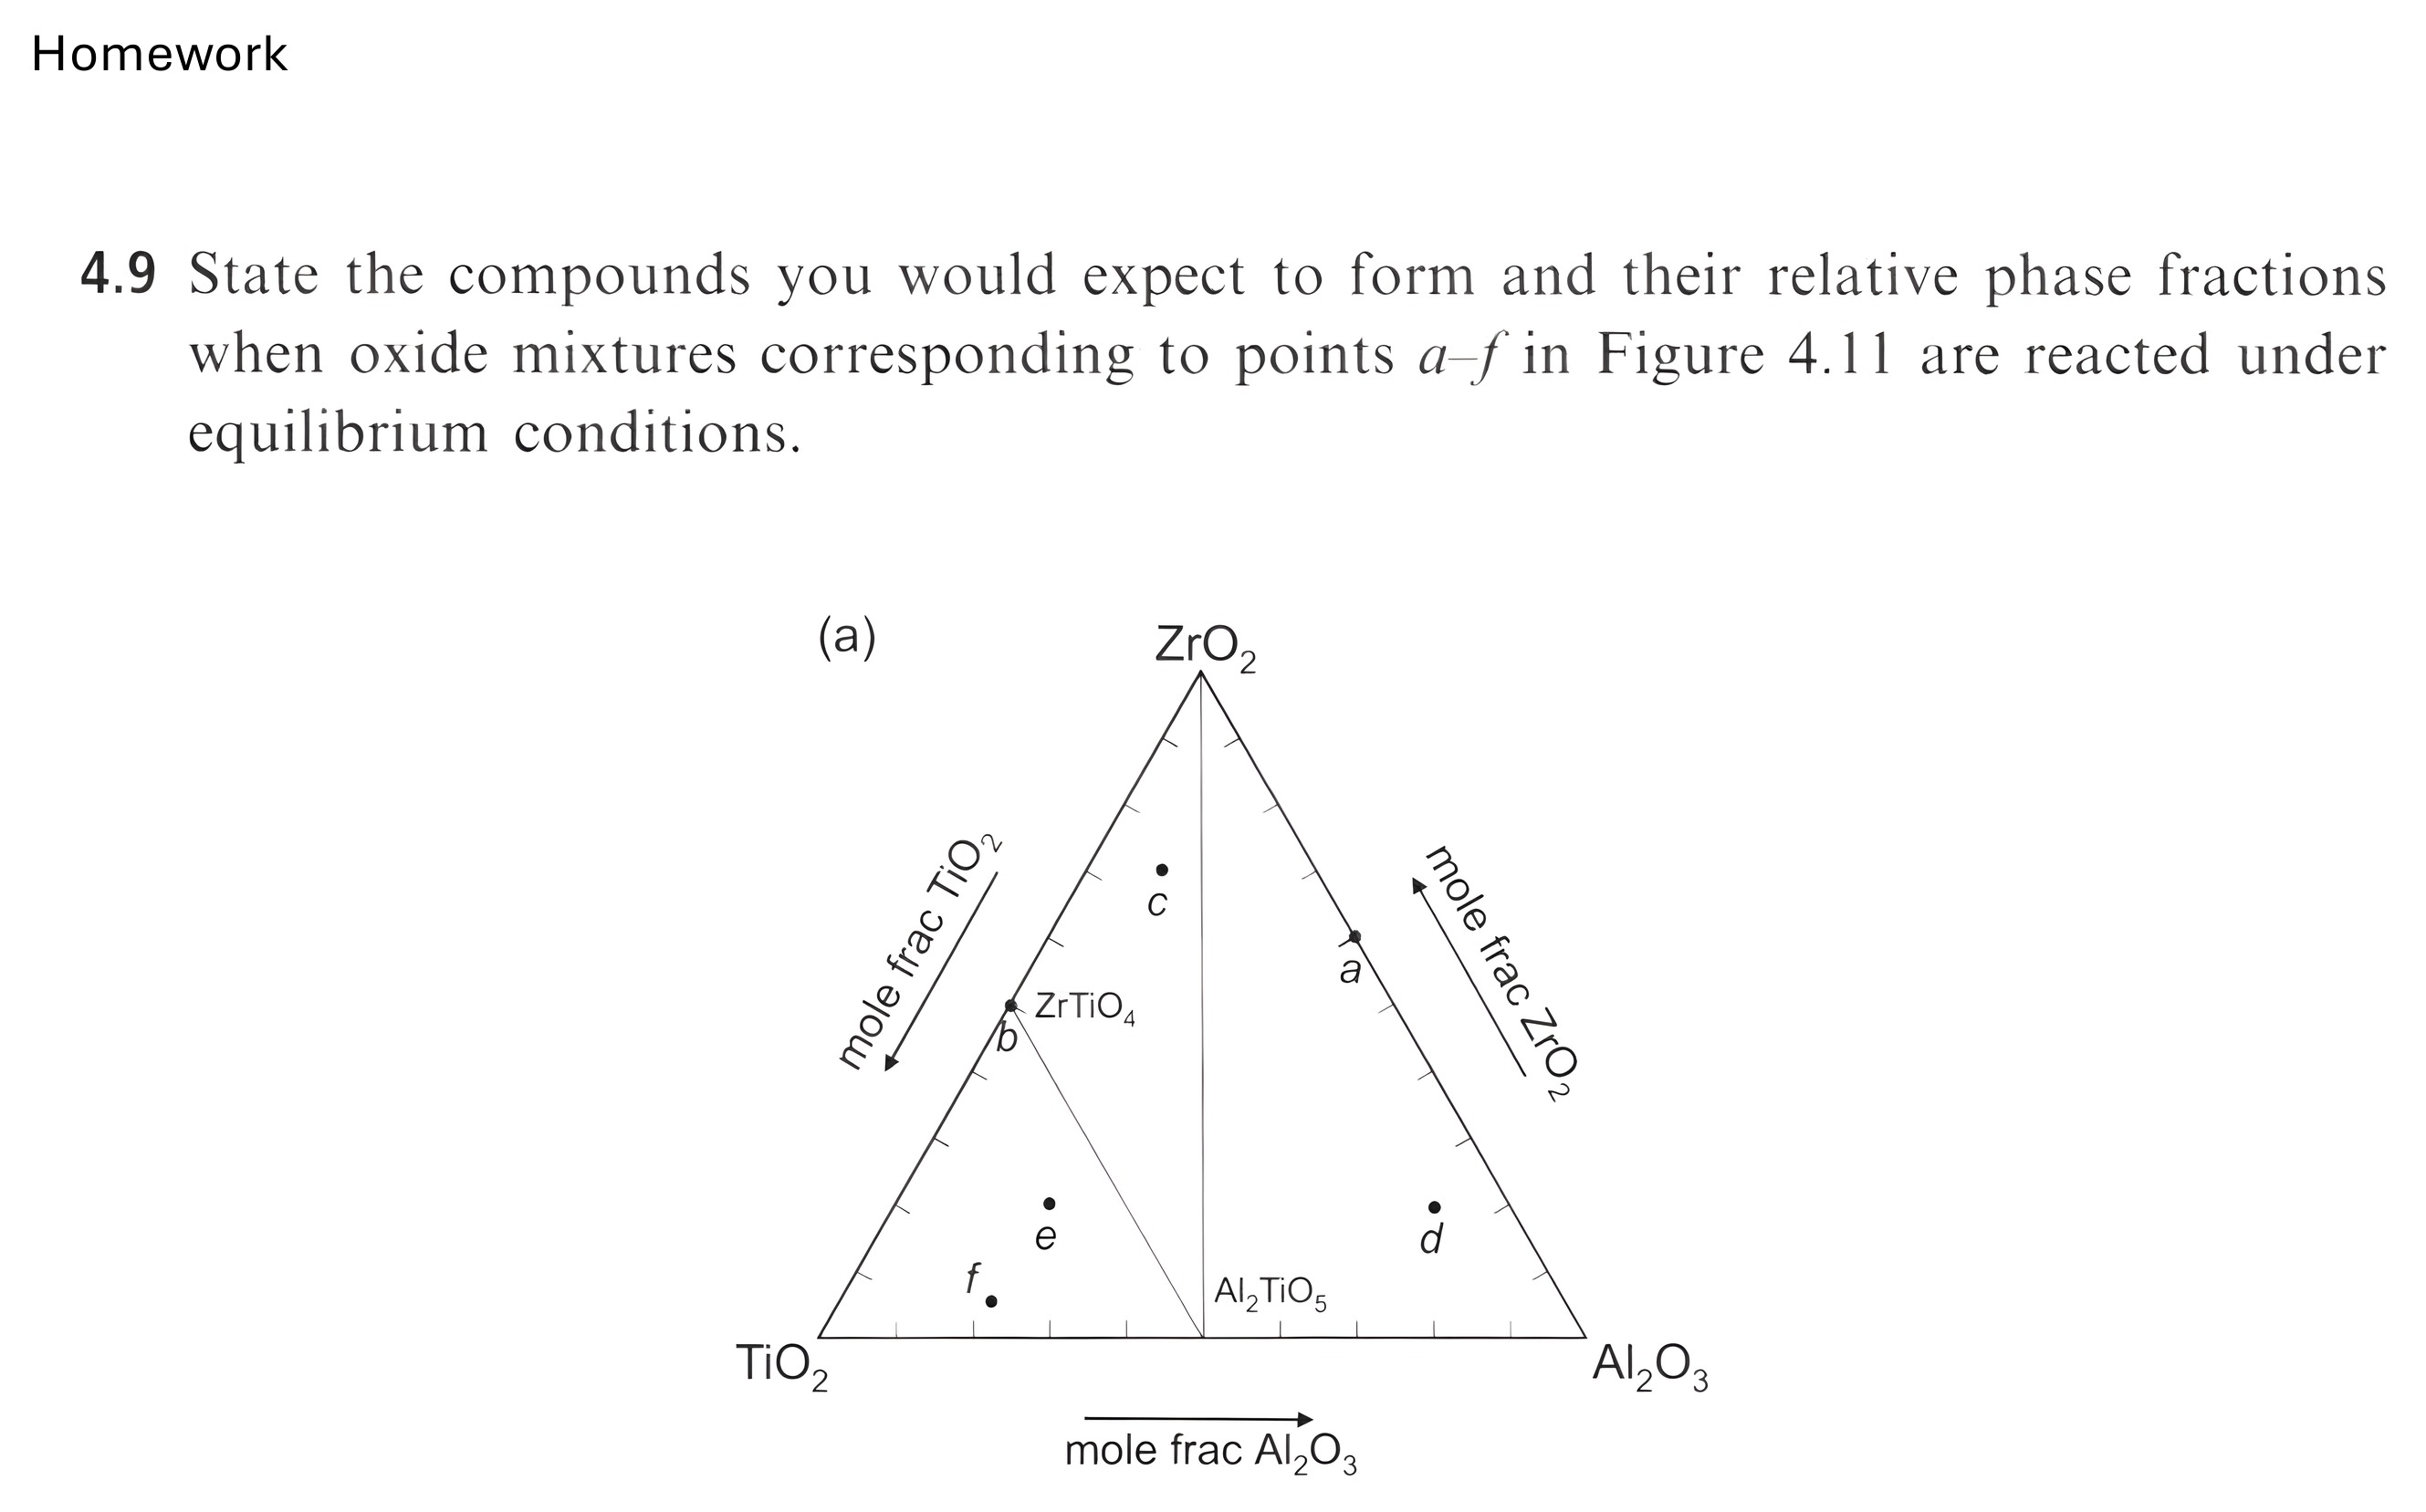
- Identify which phases are present at a given point, line, or region of a ternary diagram.
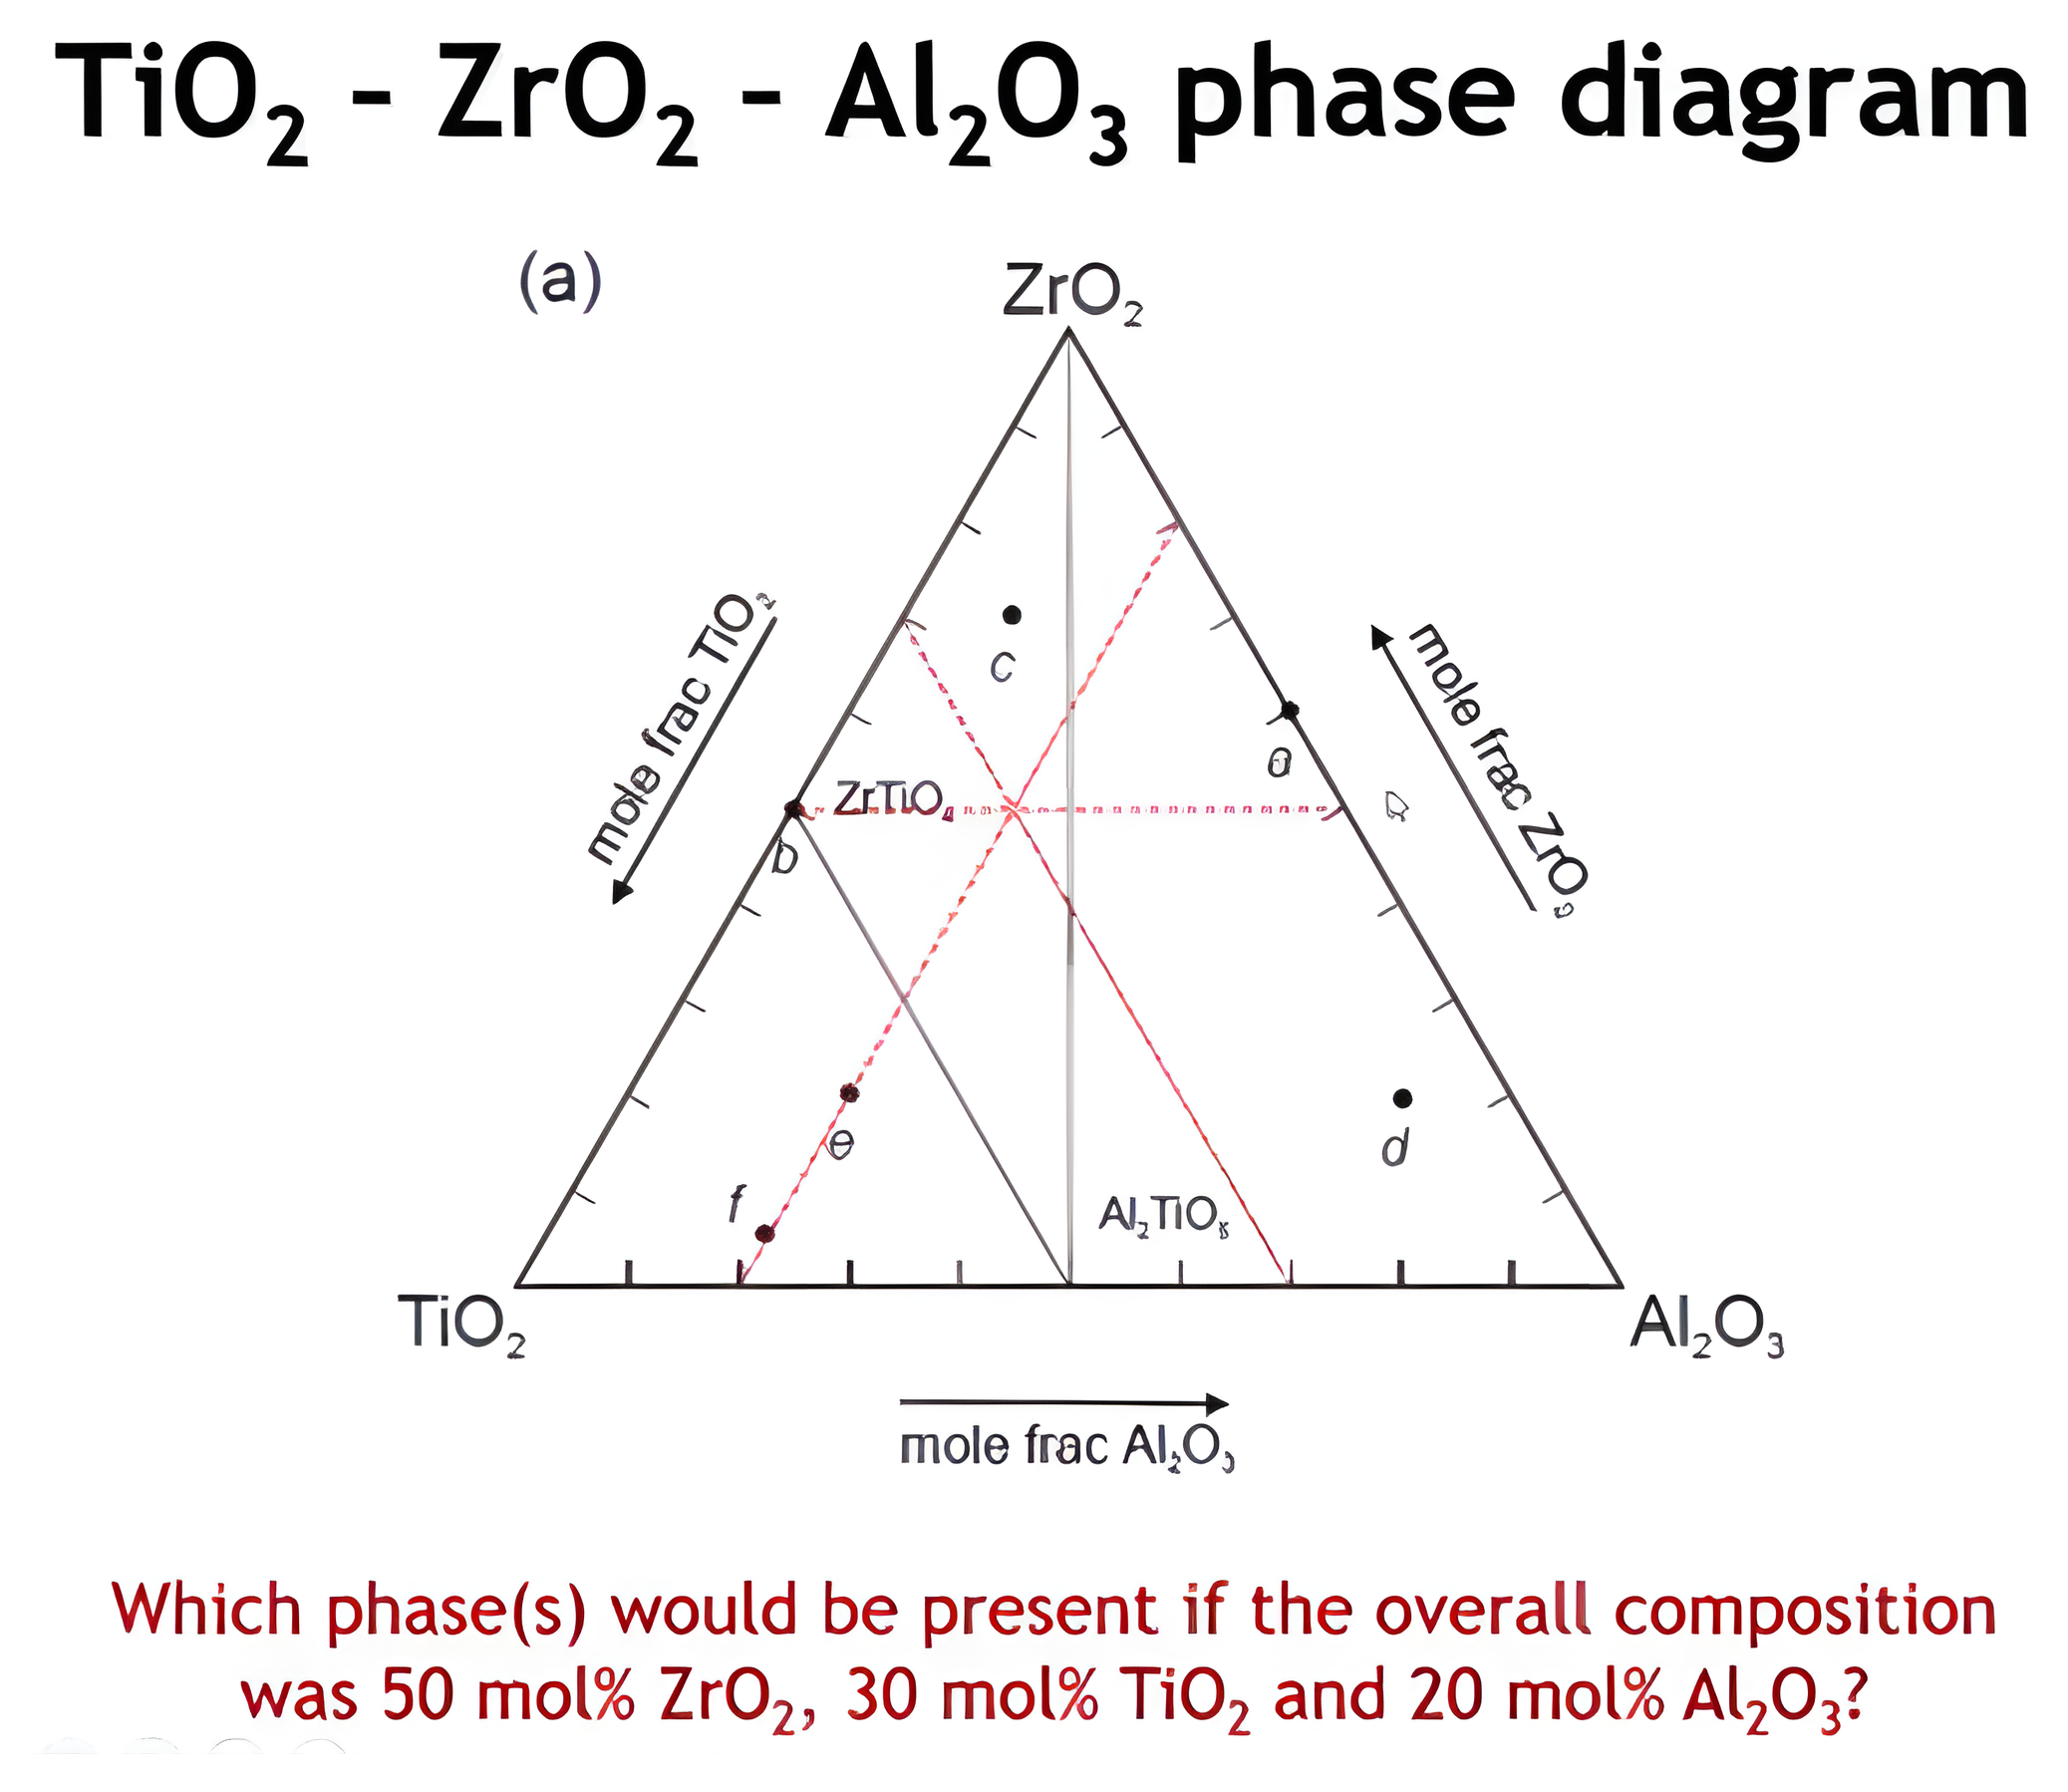
- Apply the triangle (lever) rule conceptually to determine phase fractions.
- Interpret real ternary phase diagrams (e.g., TiO₂–ZrO₂–Al₂O₃, Y₂O₃–BaO–CuO systems).
Summary: Ternary Phase Diagrams
- Phase diagrams represent thermodynamic stability of phases as a function of composition, T, and P.
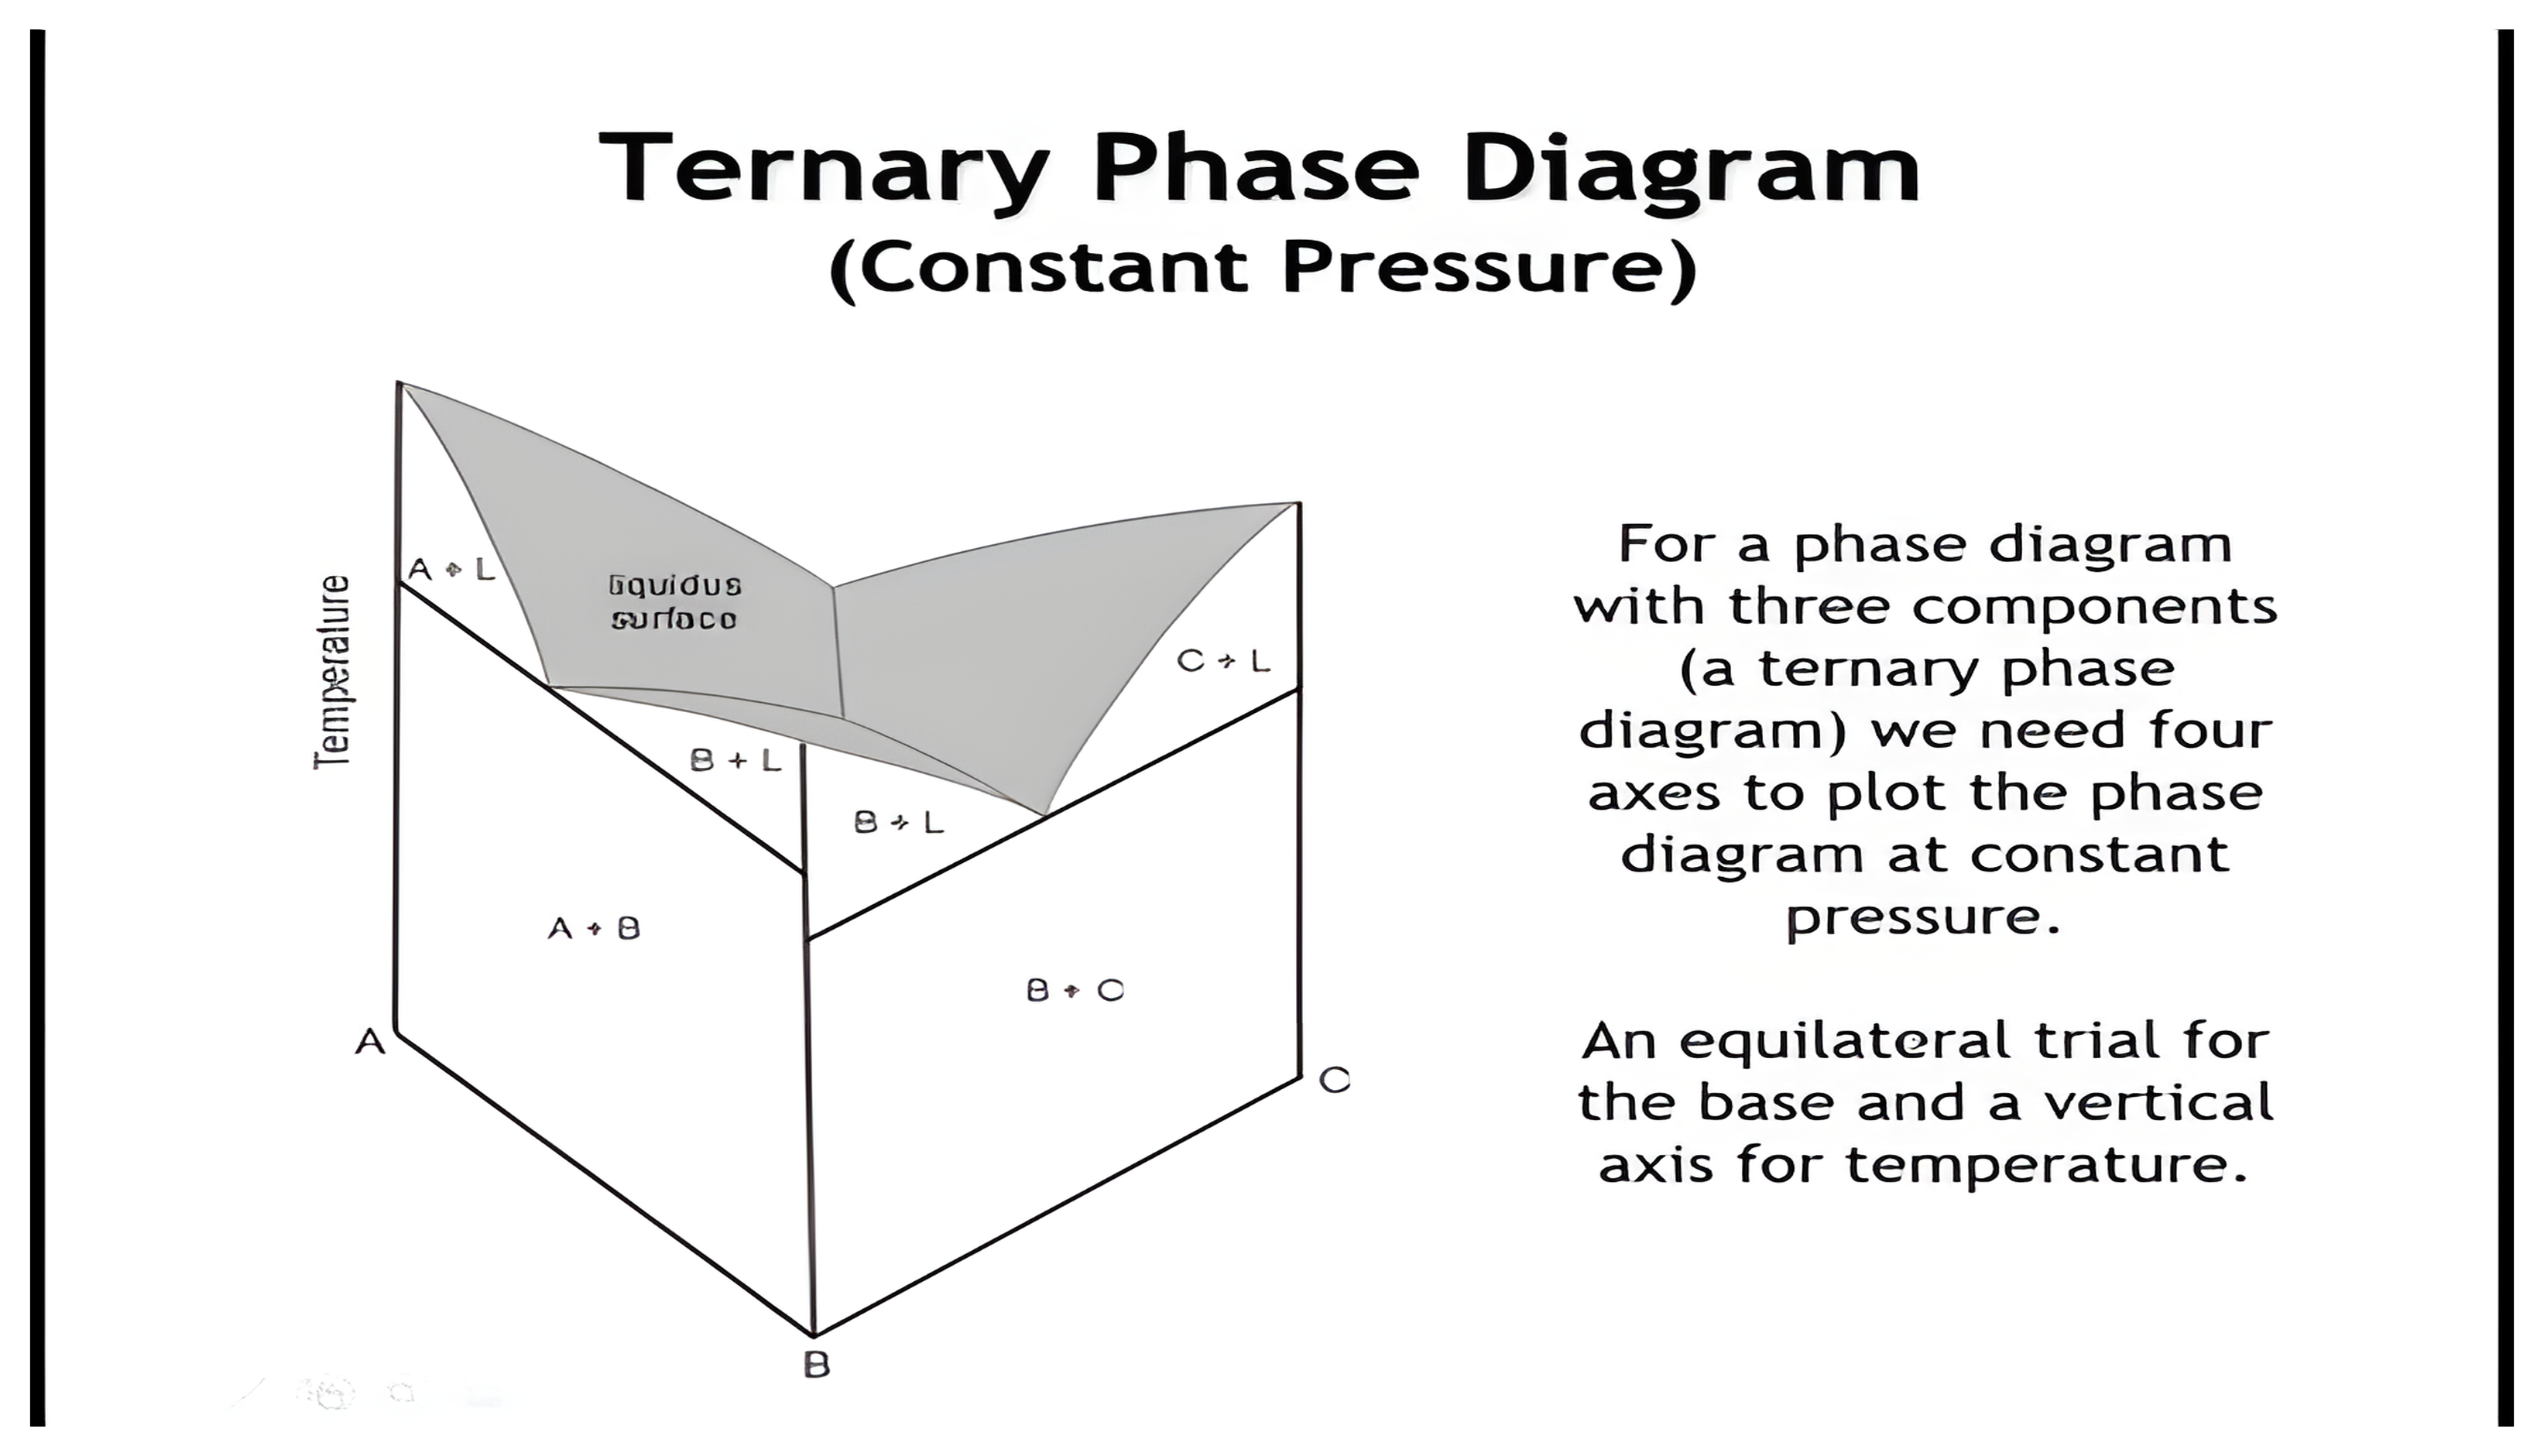
- A full ternary system requires 5D (3 compositions + T + P) → simplified by fixing pressure, often slicing at constant T.
- 2D triangular diagrams represent isothermal sections below the liquidus.
- Each point in the triangle = a unique composition (relative fractions of A–B–C).
- Tie-lines connect coexisting phases; tie-triangles define three-phase equilibria.
- Lever rule applies inside two-phase and three-phase regions.
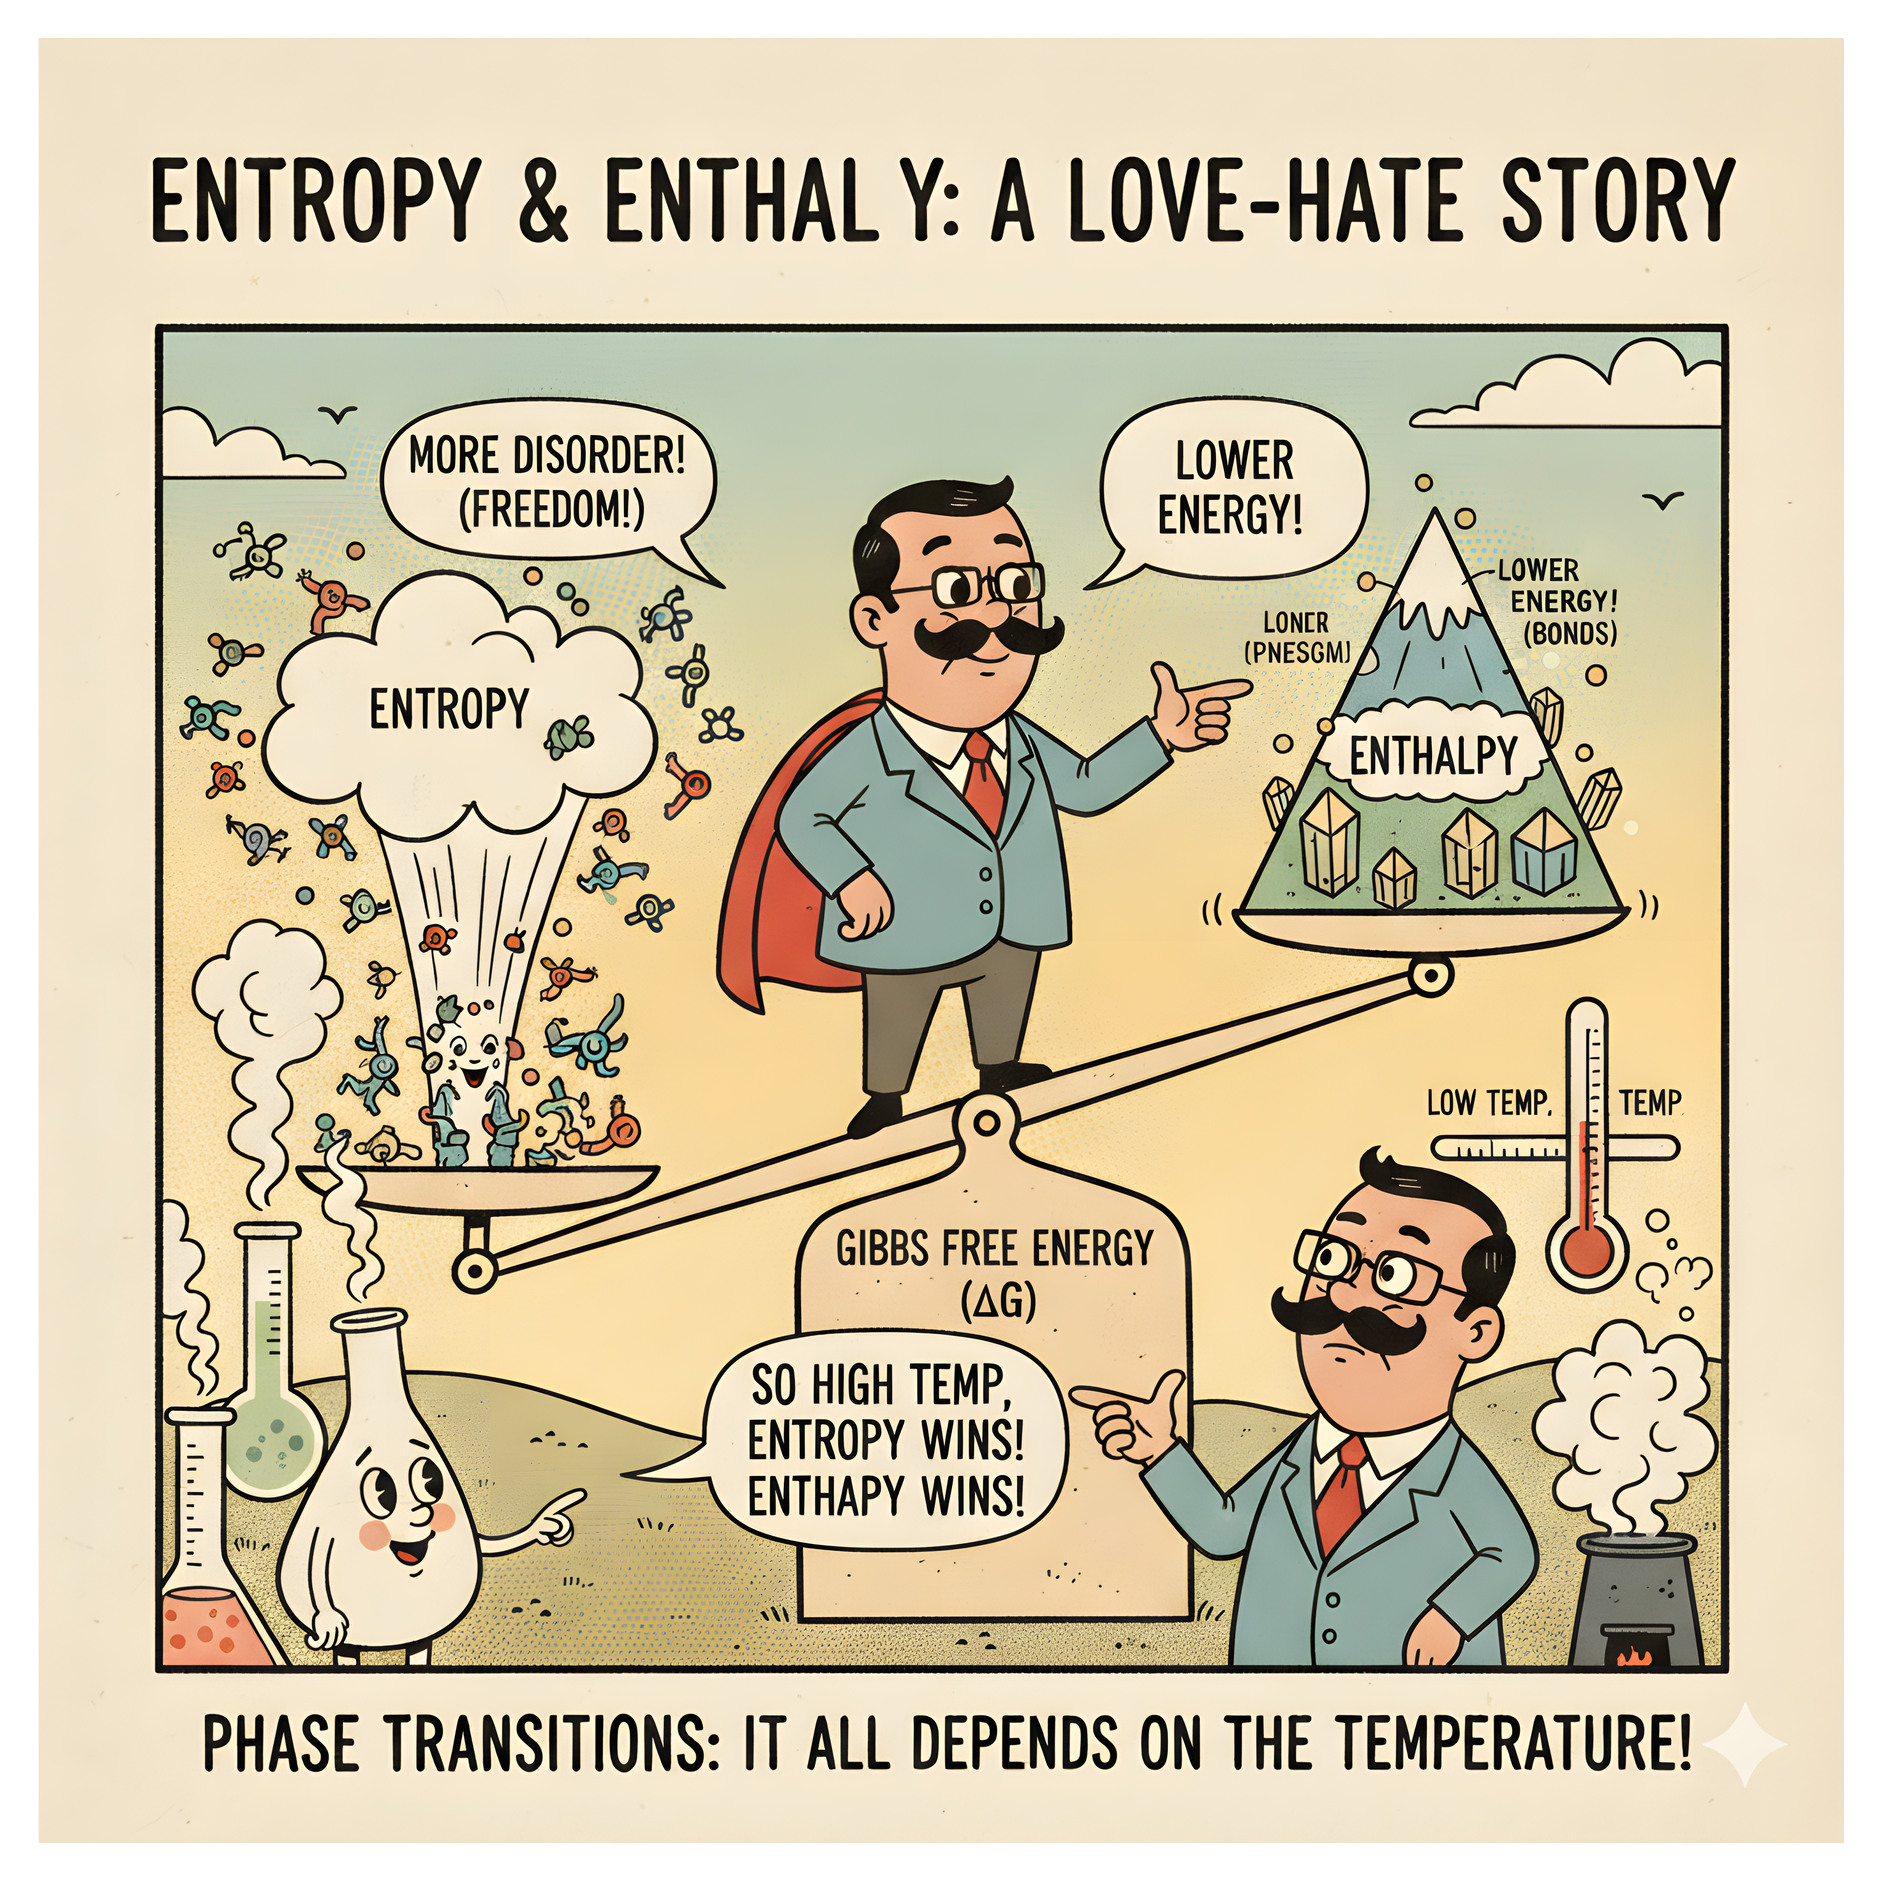
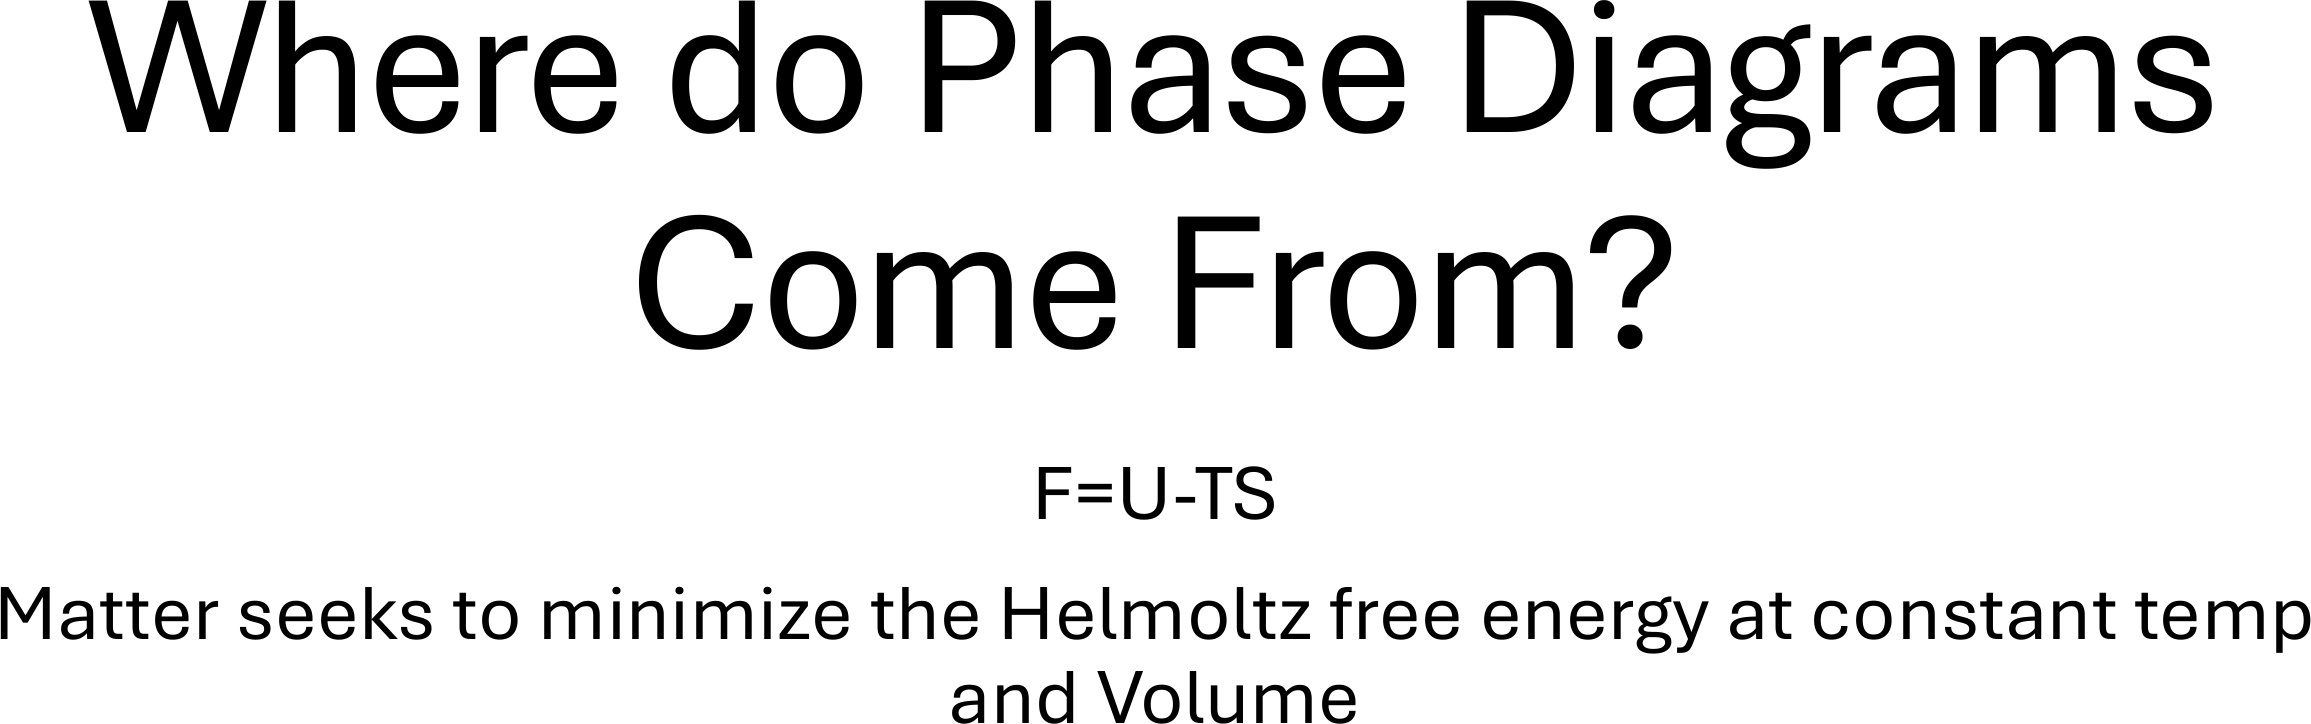
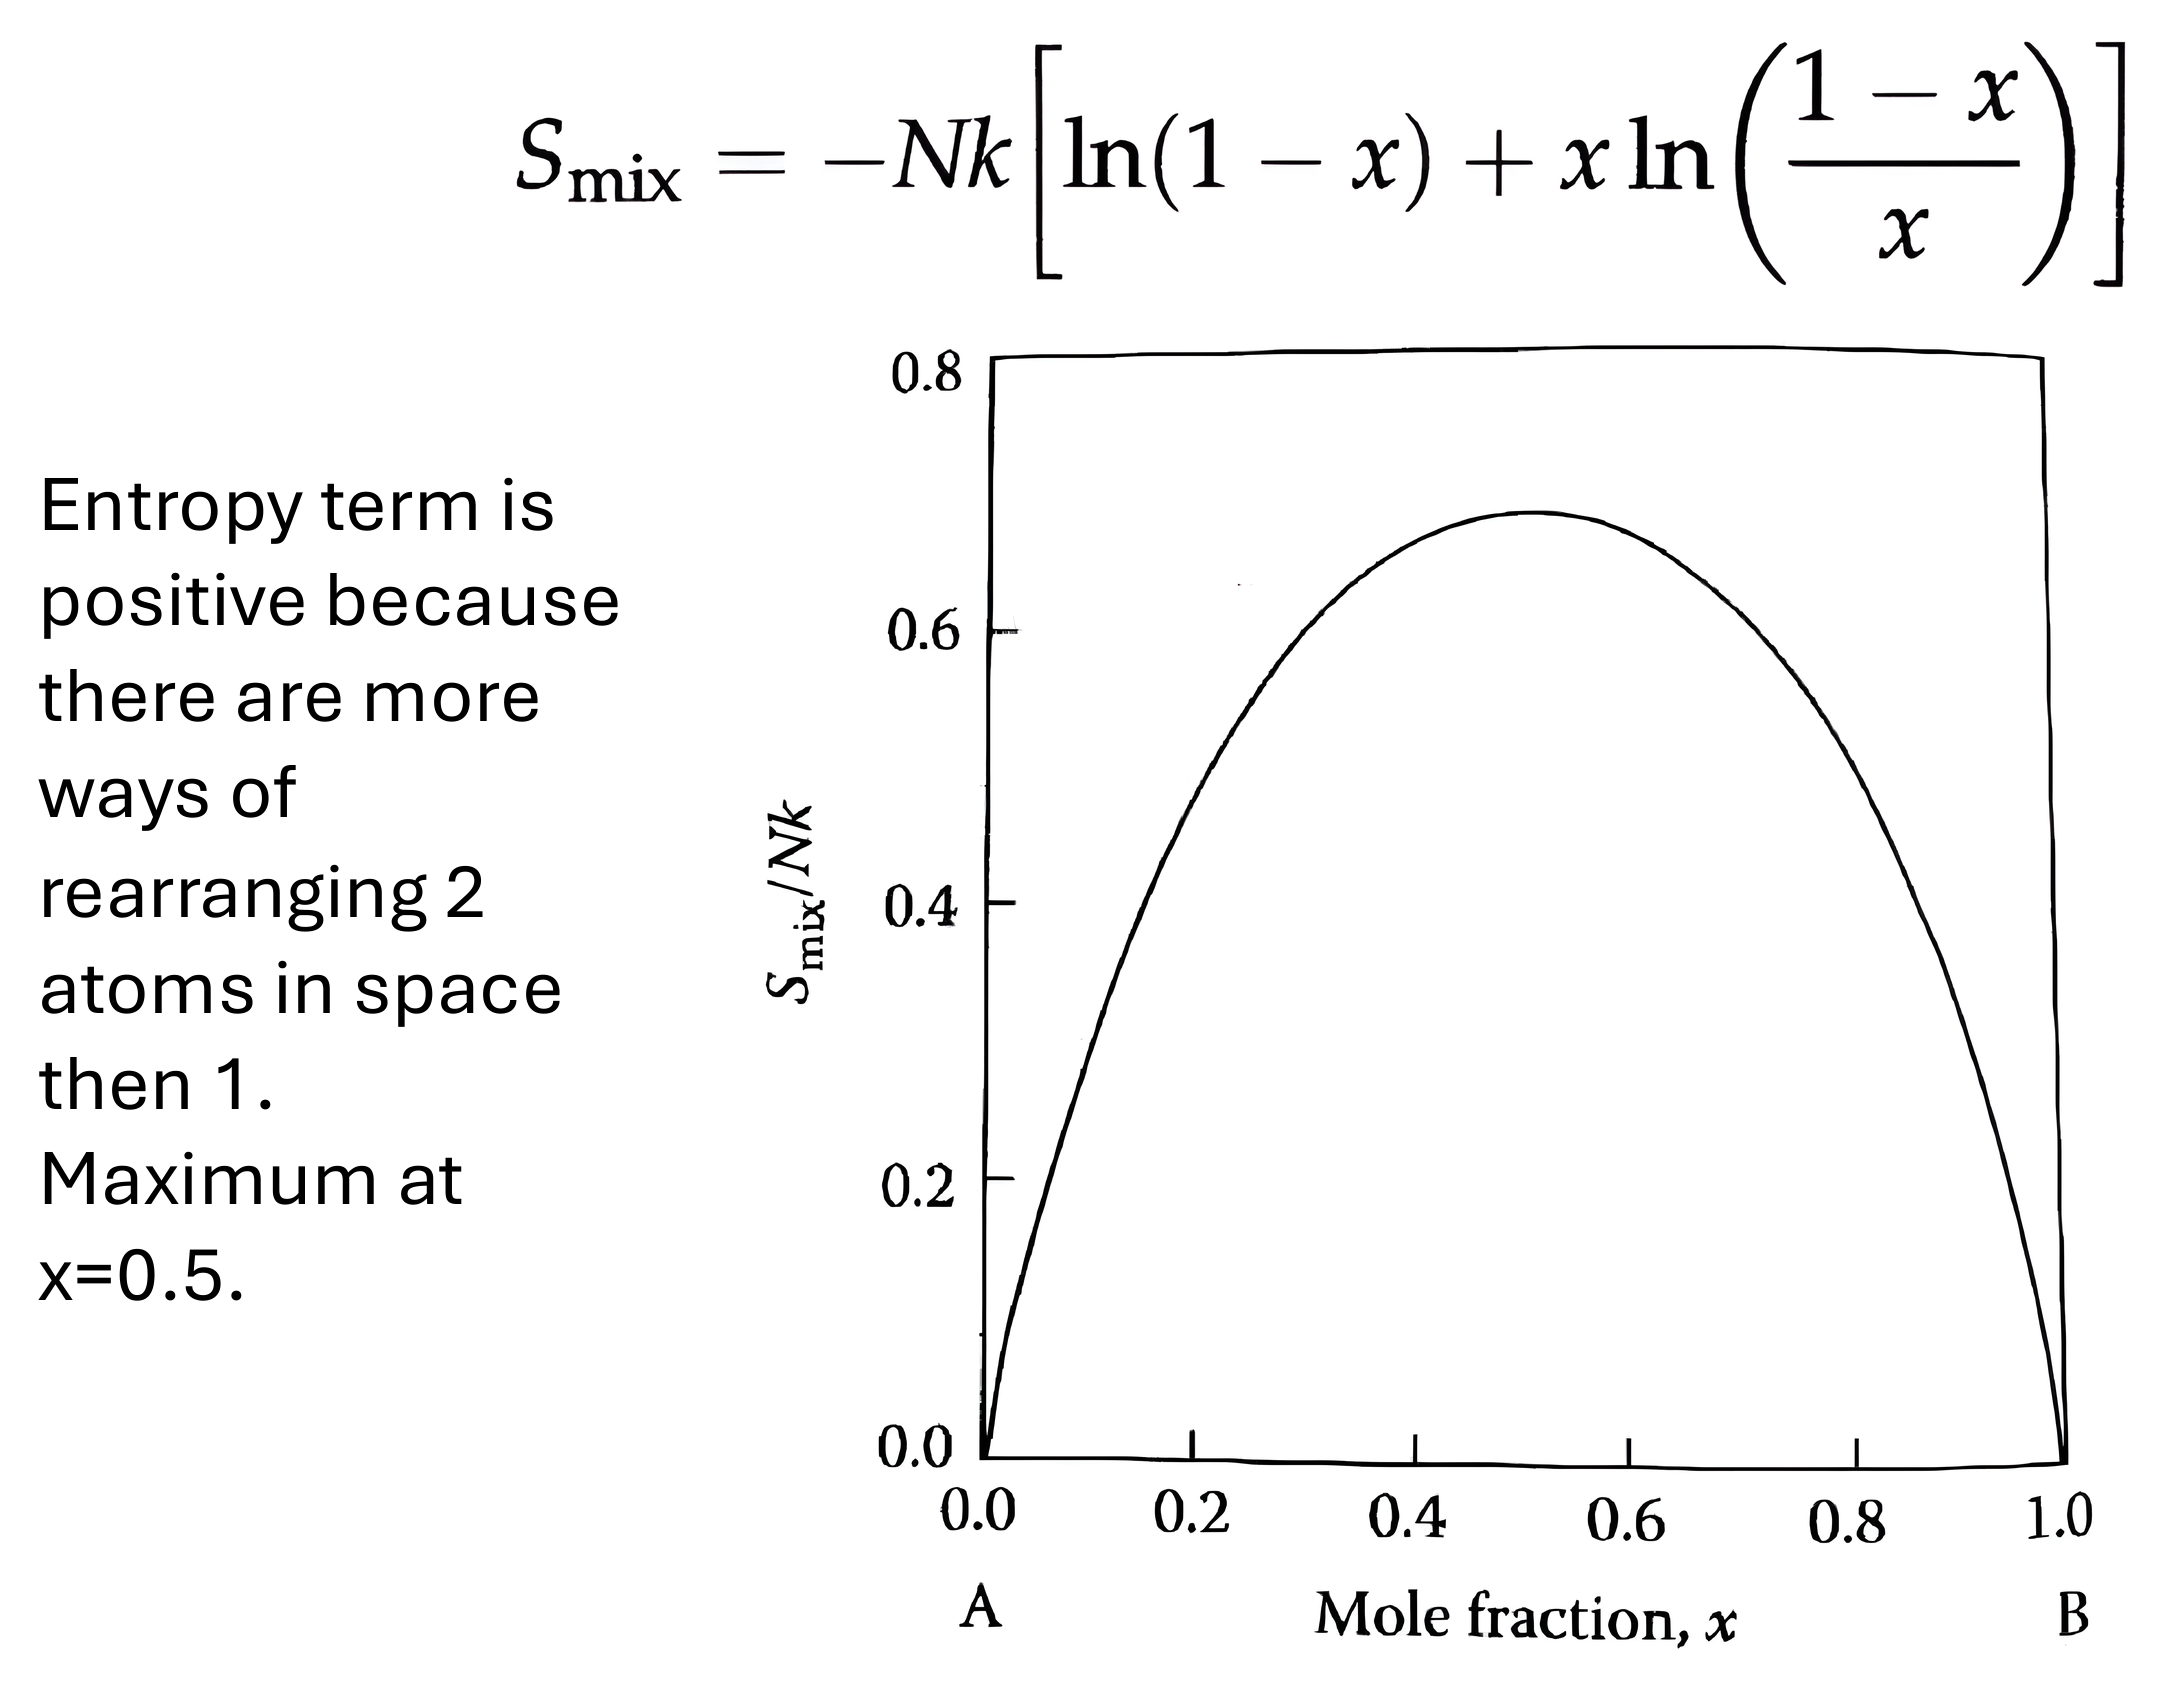
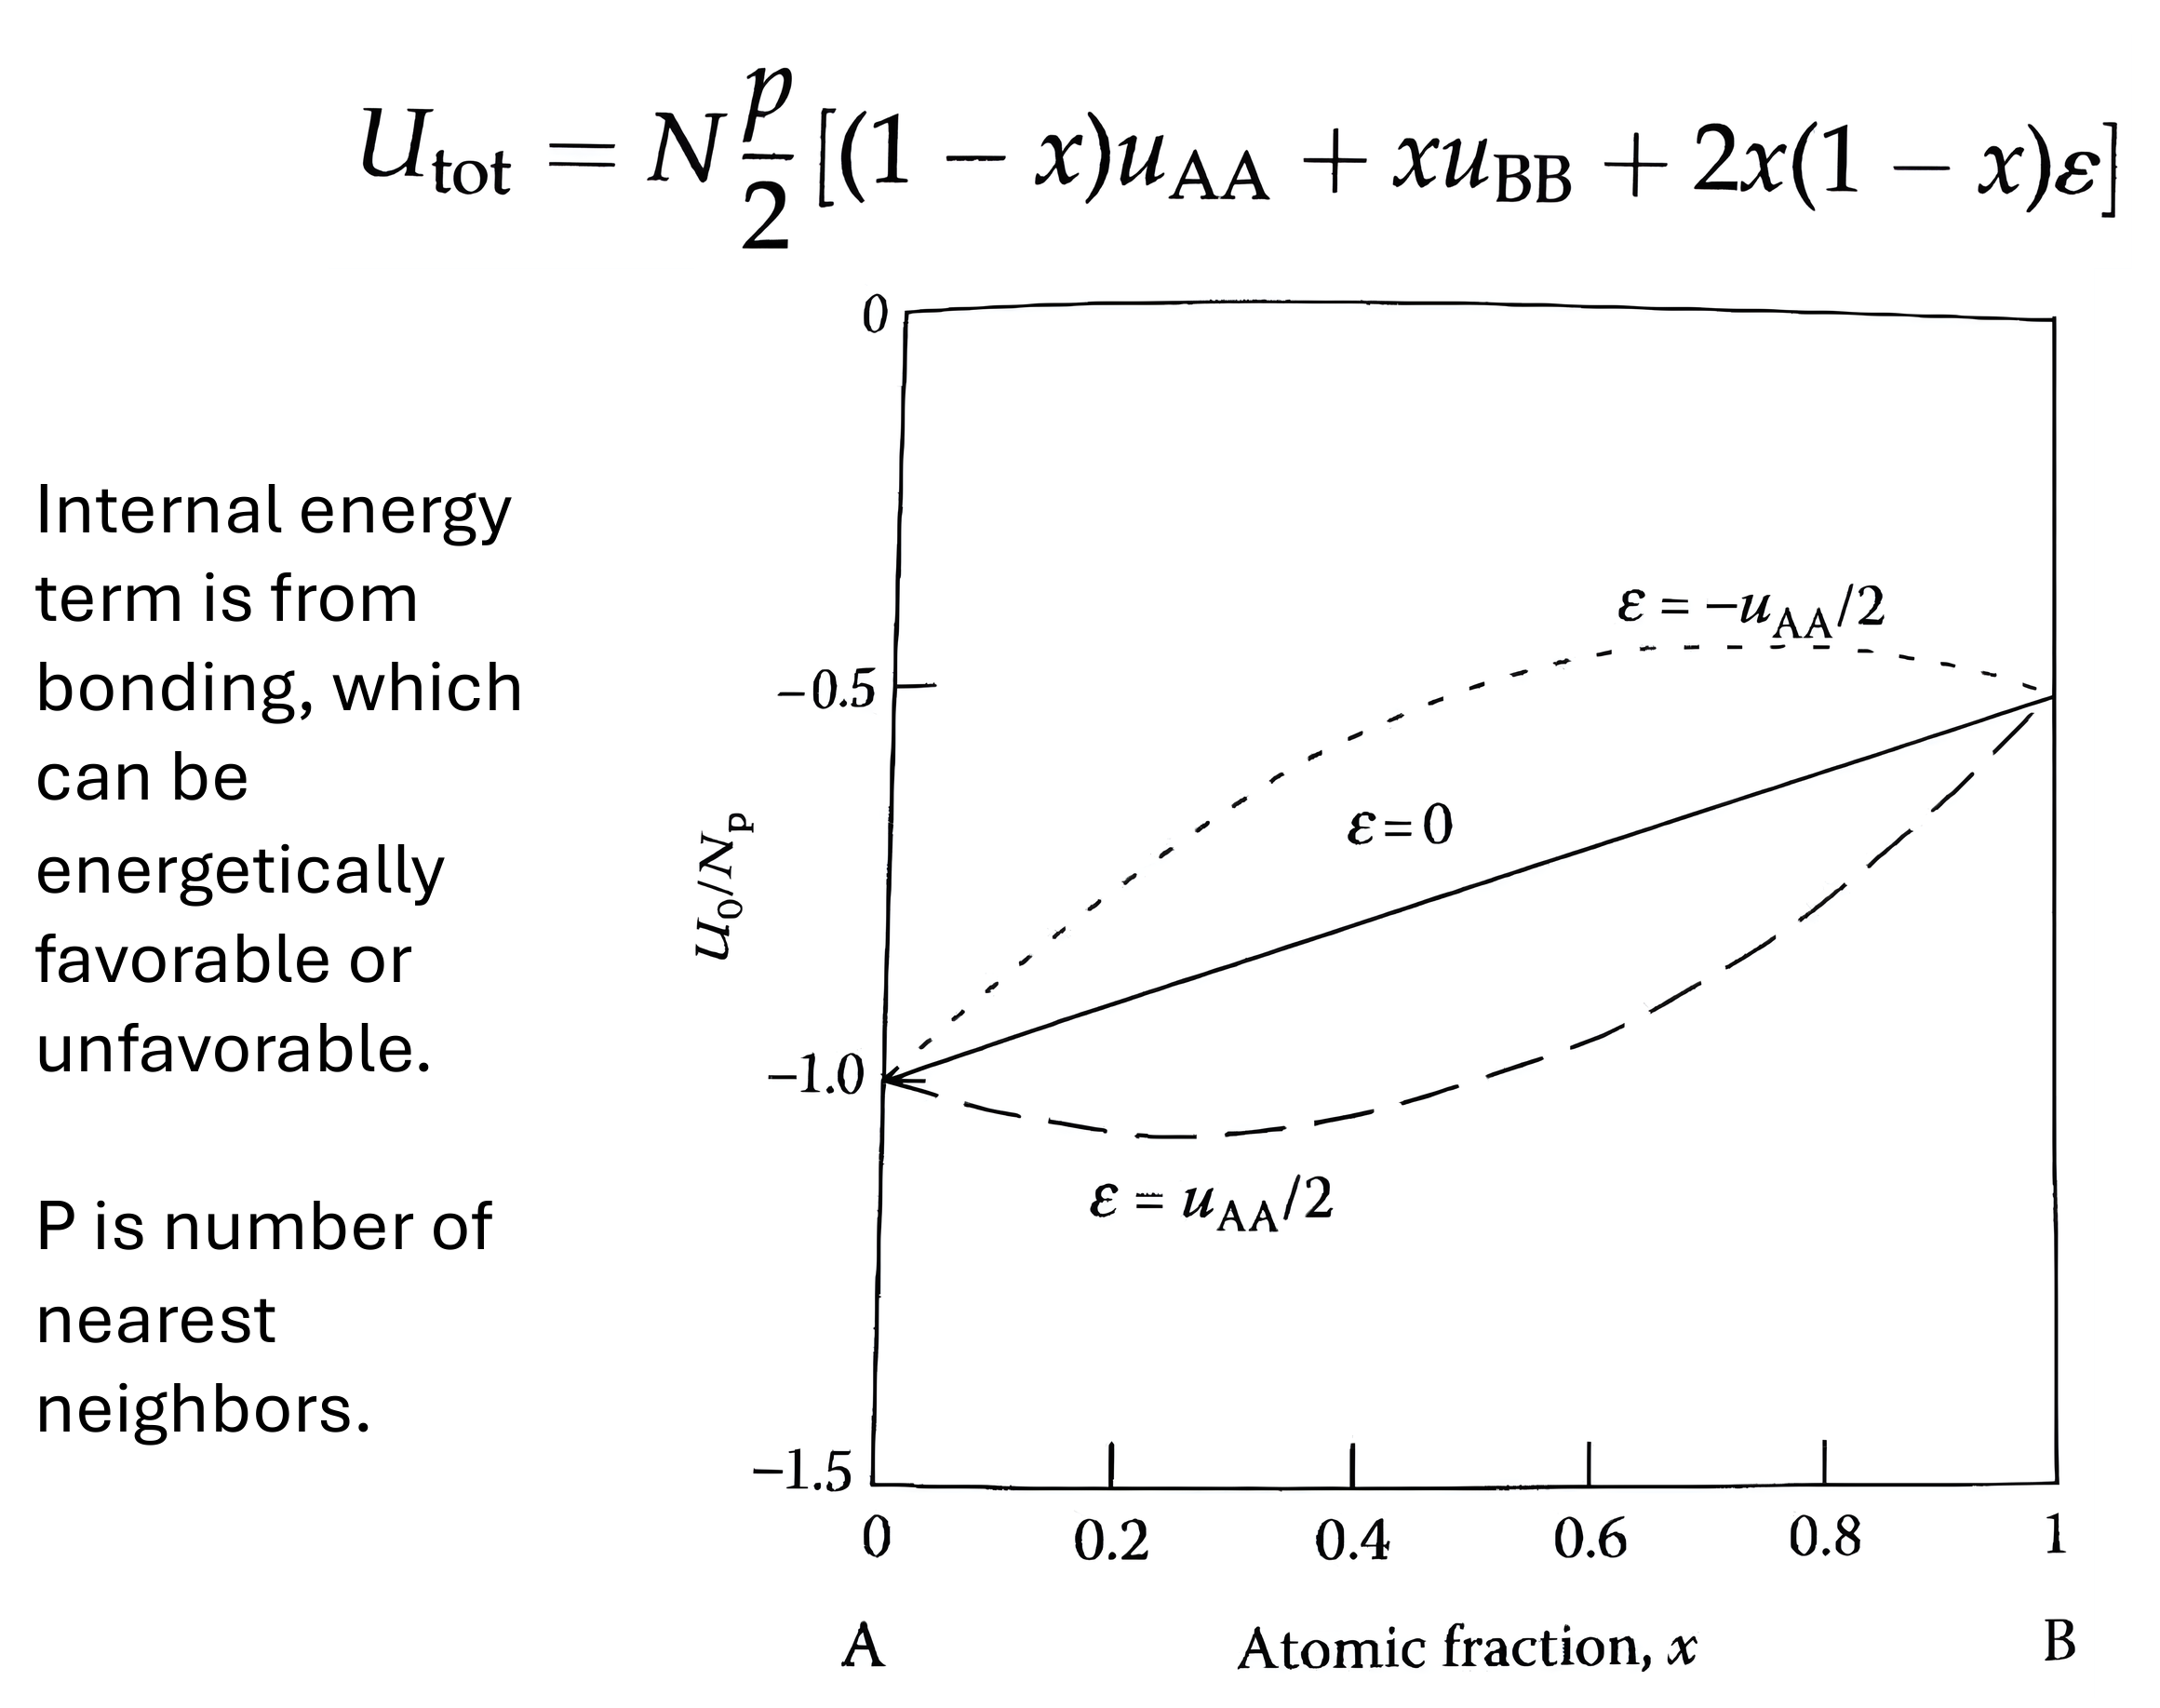
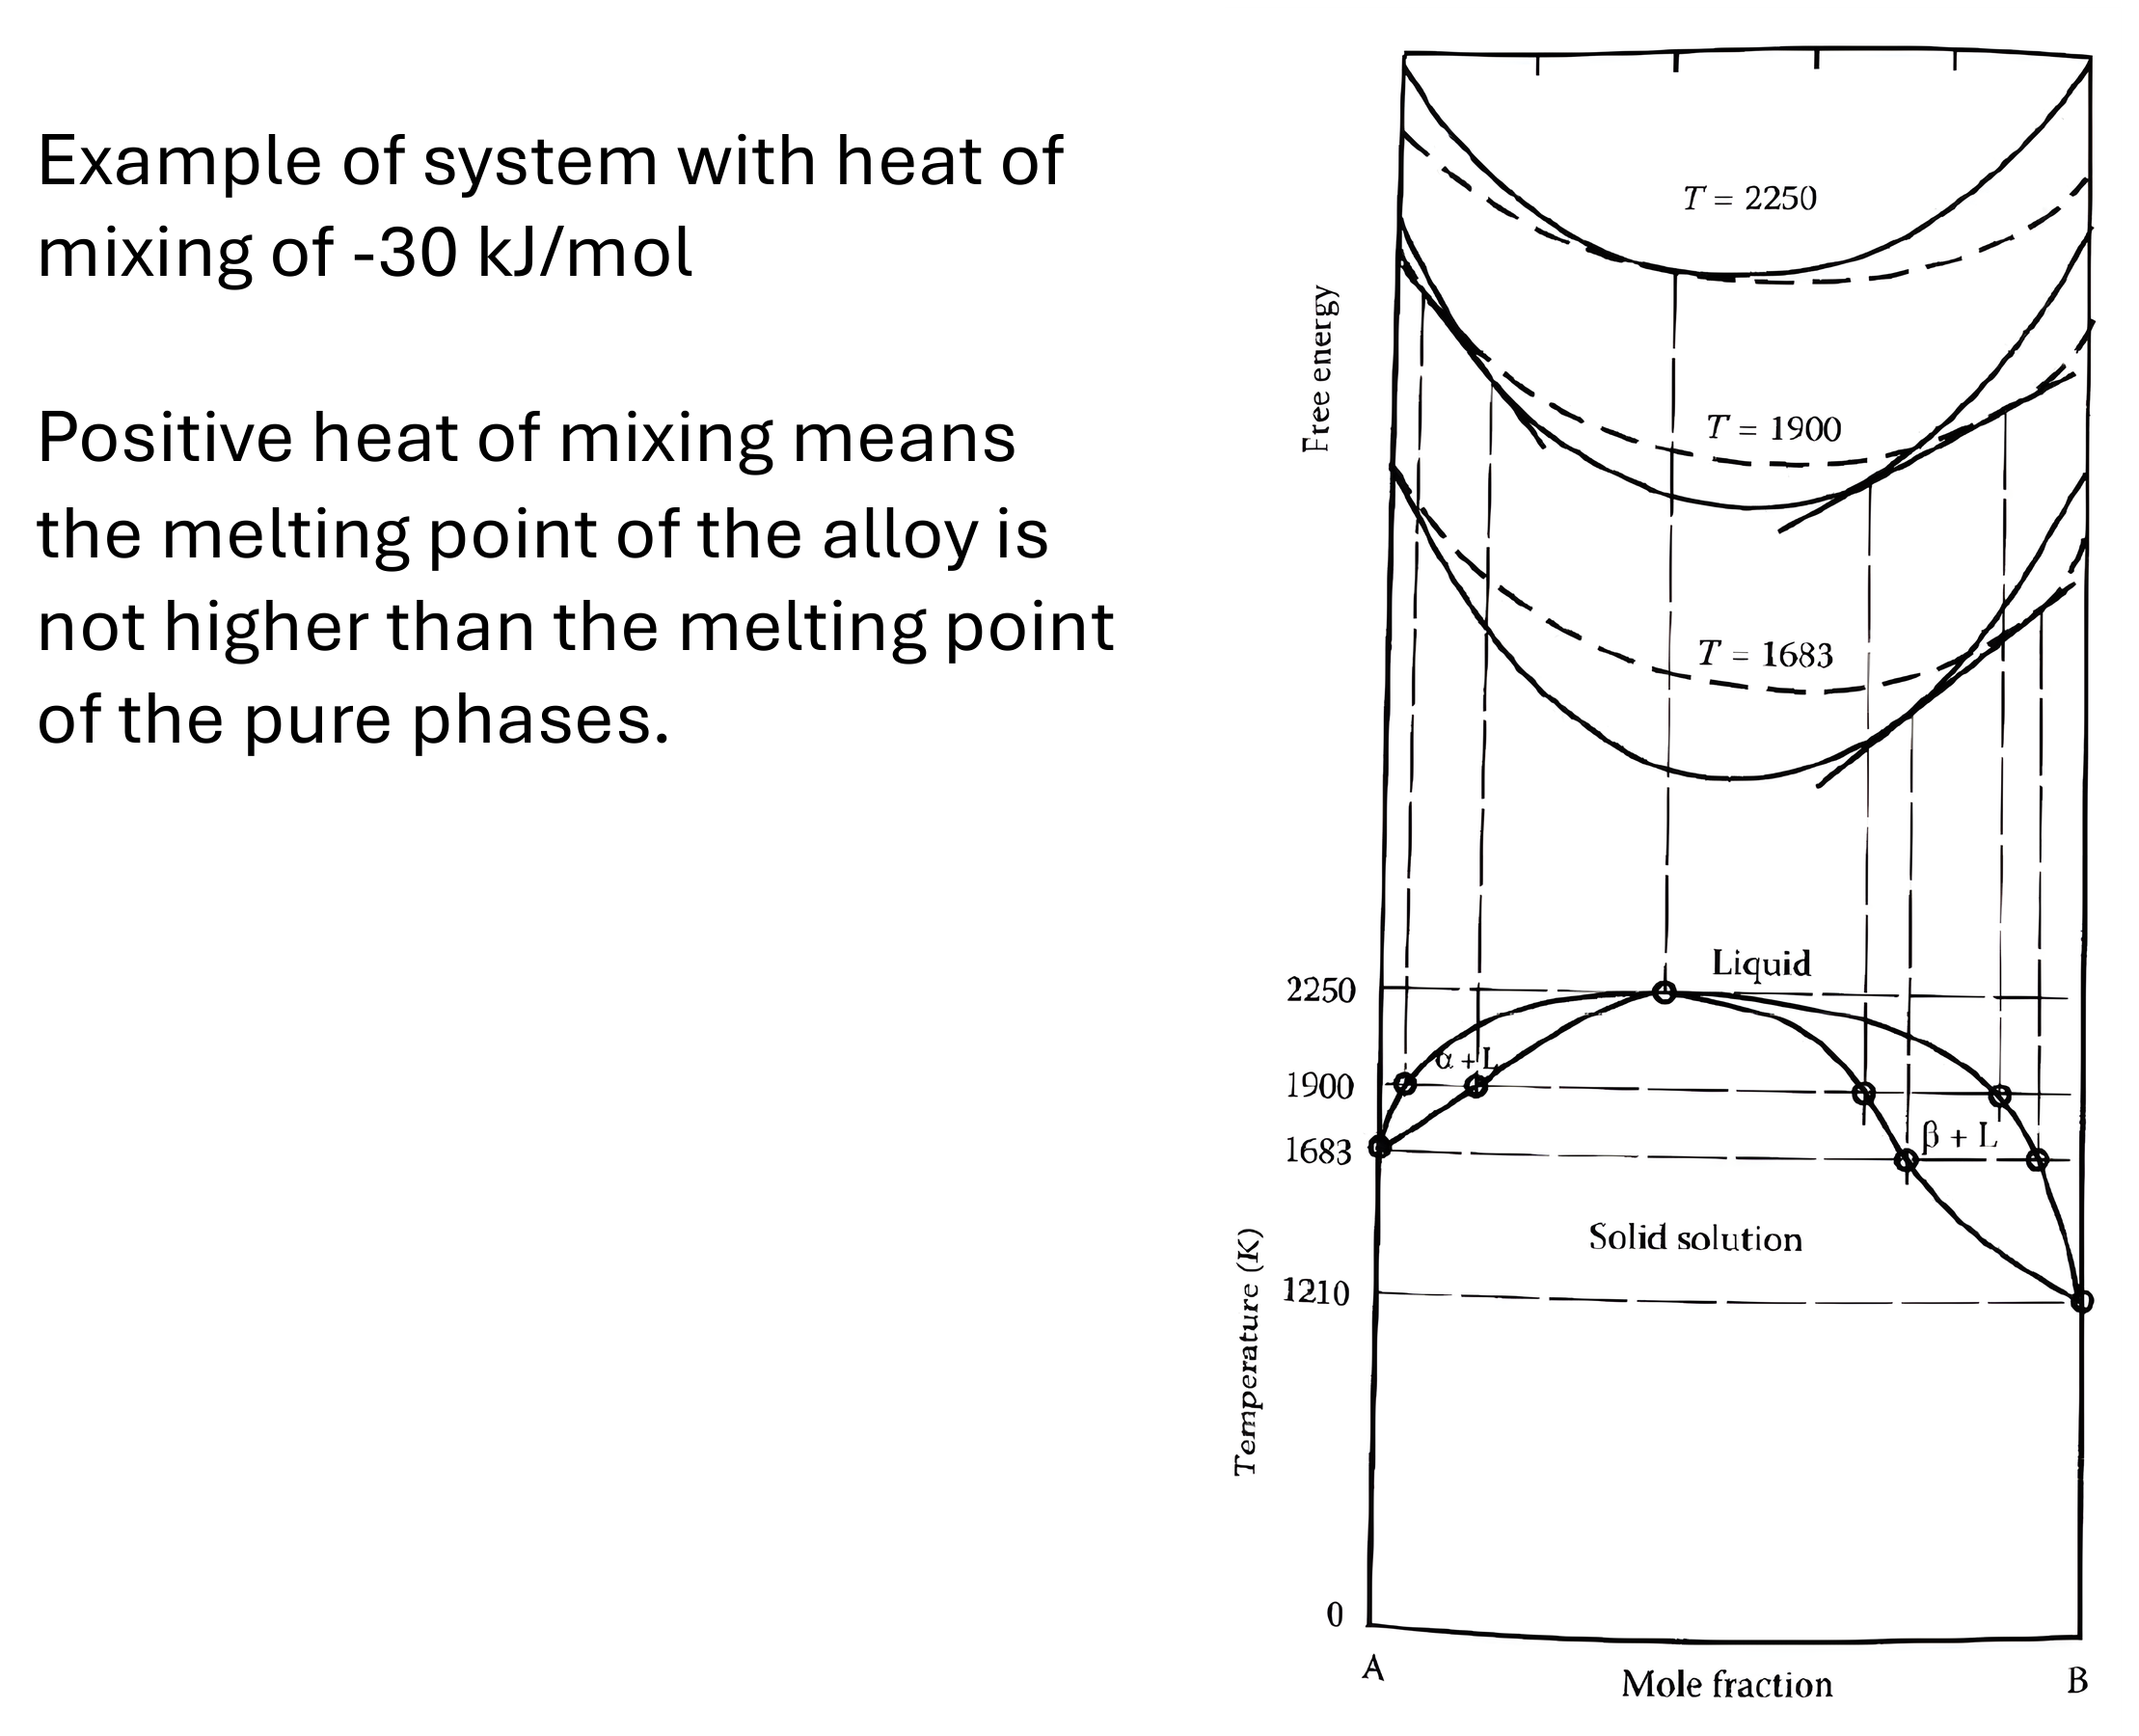
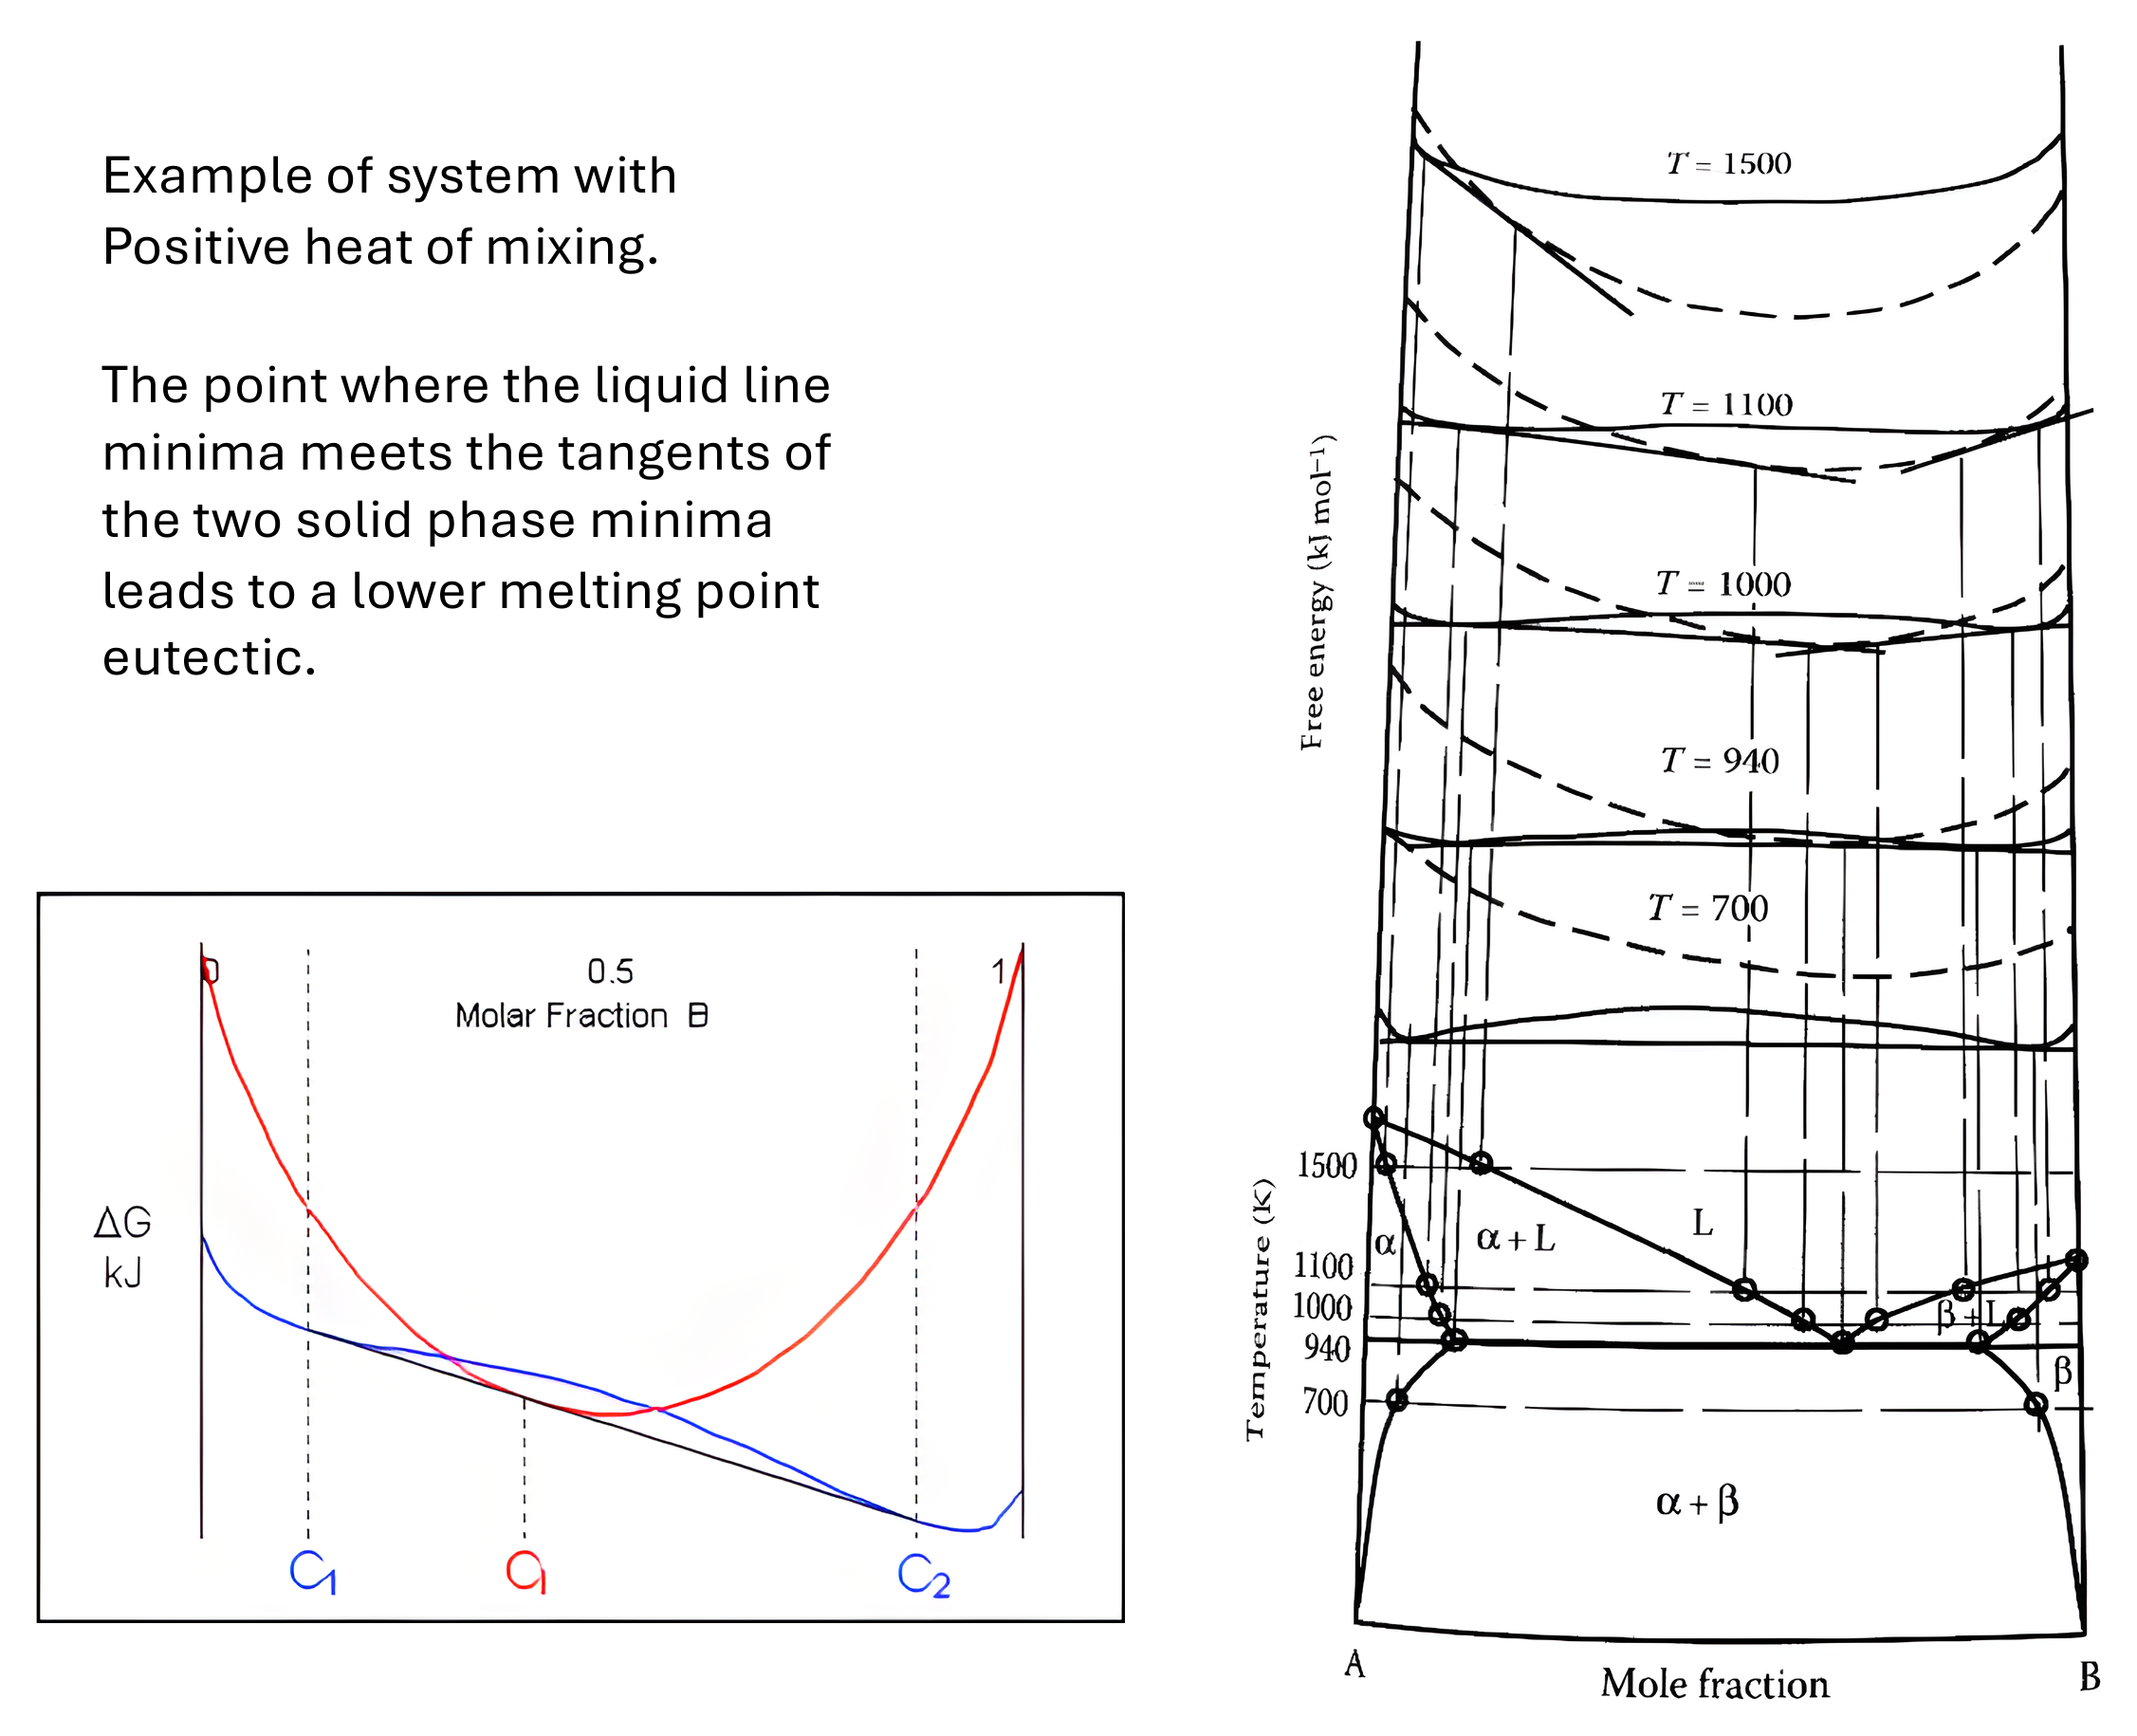
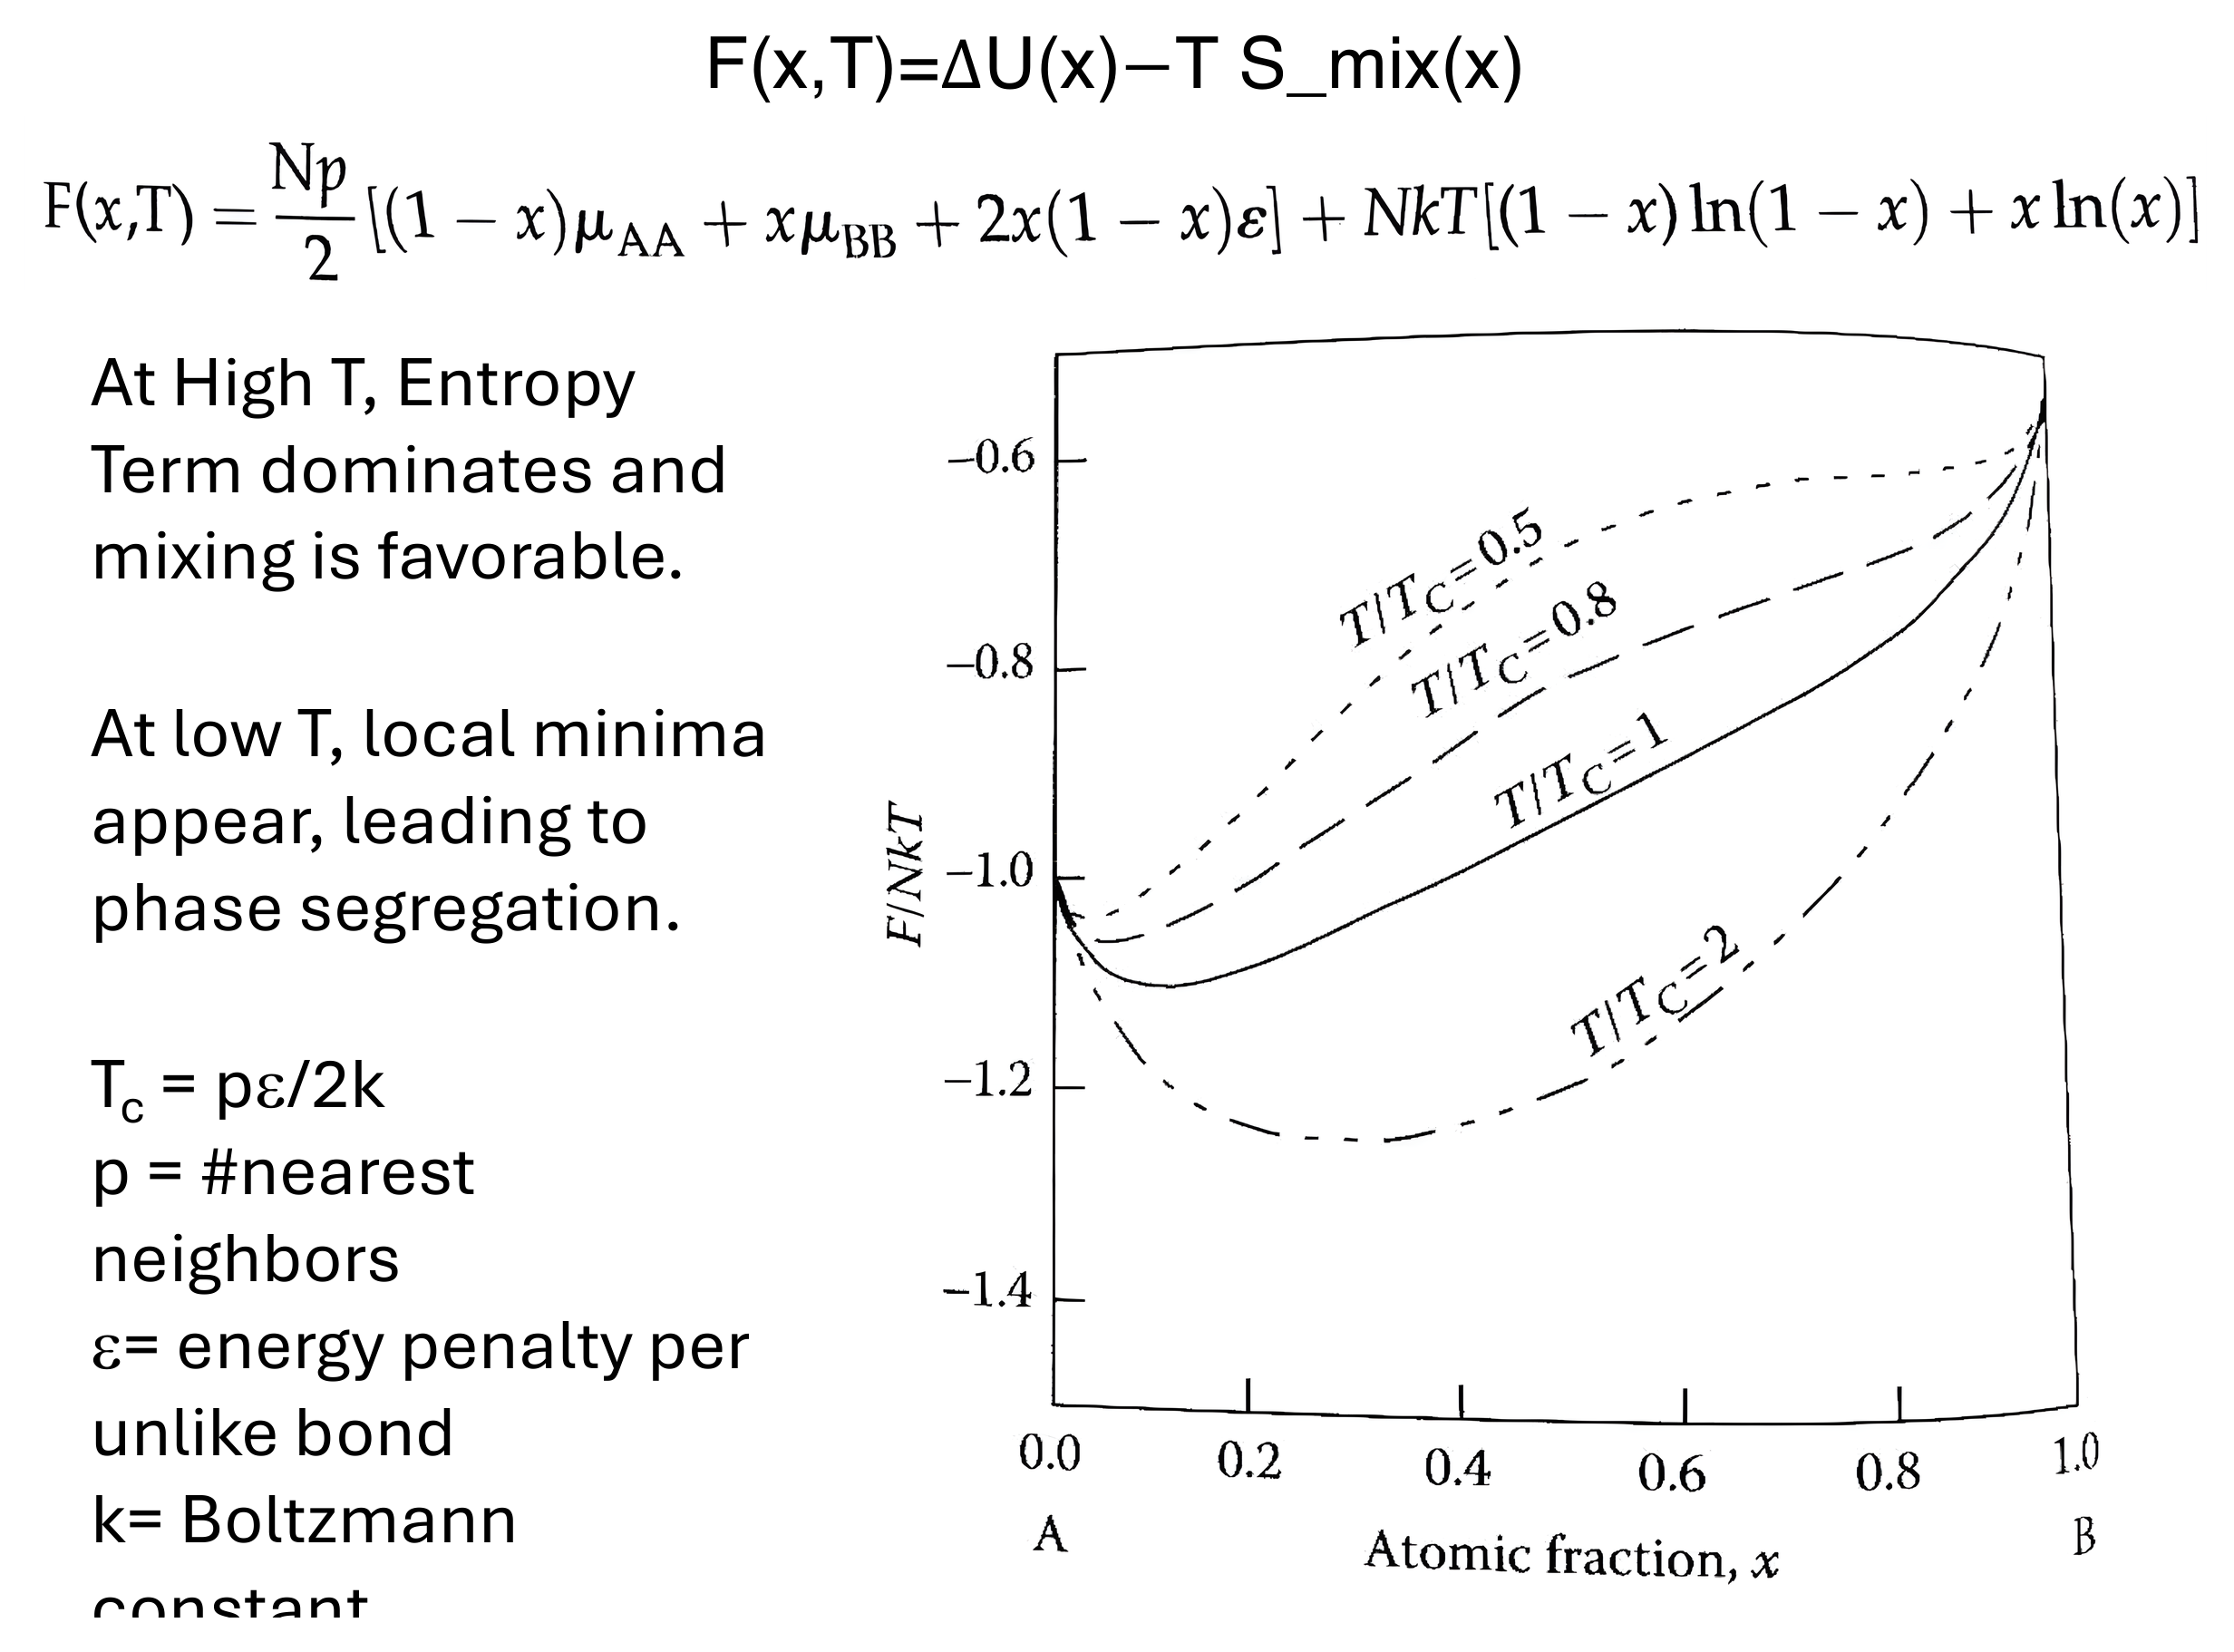 $F(x,T)=\Delta U(x)-T S_{mix}(x)$
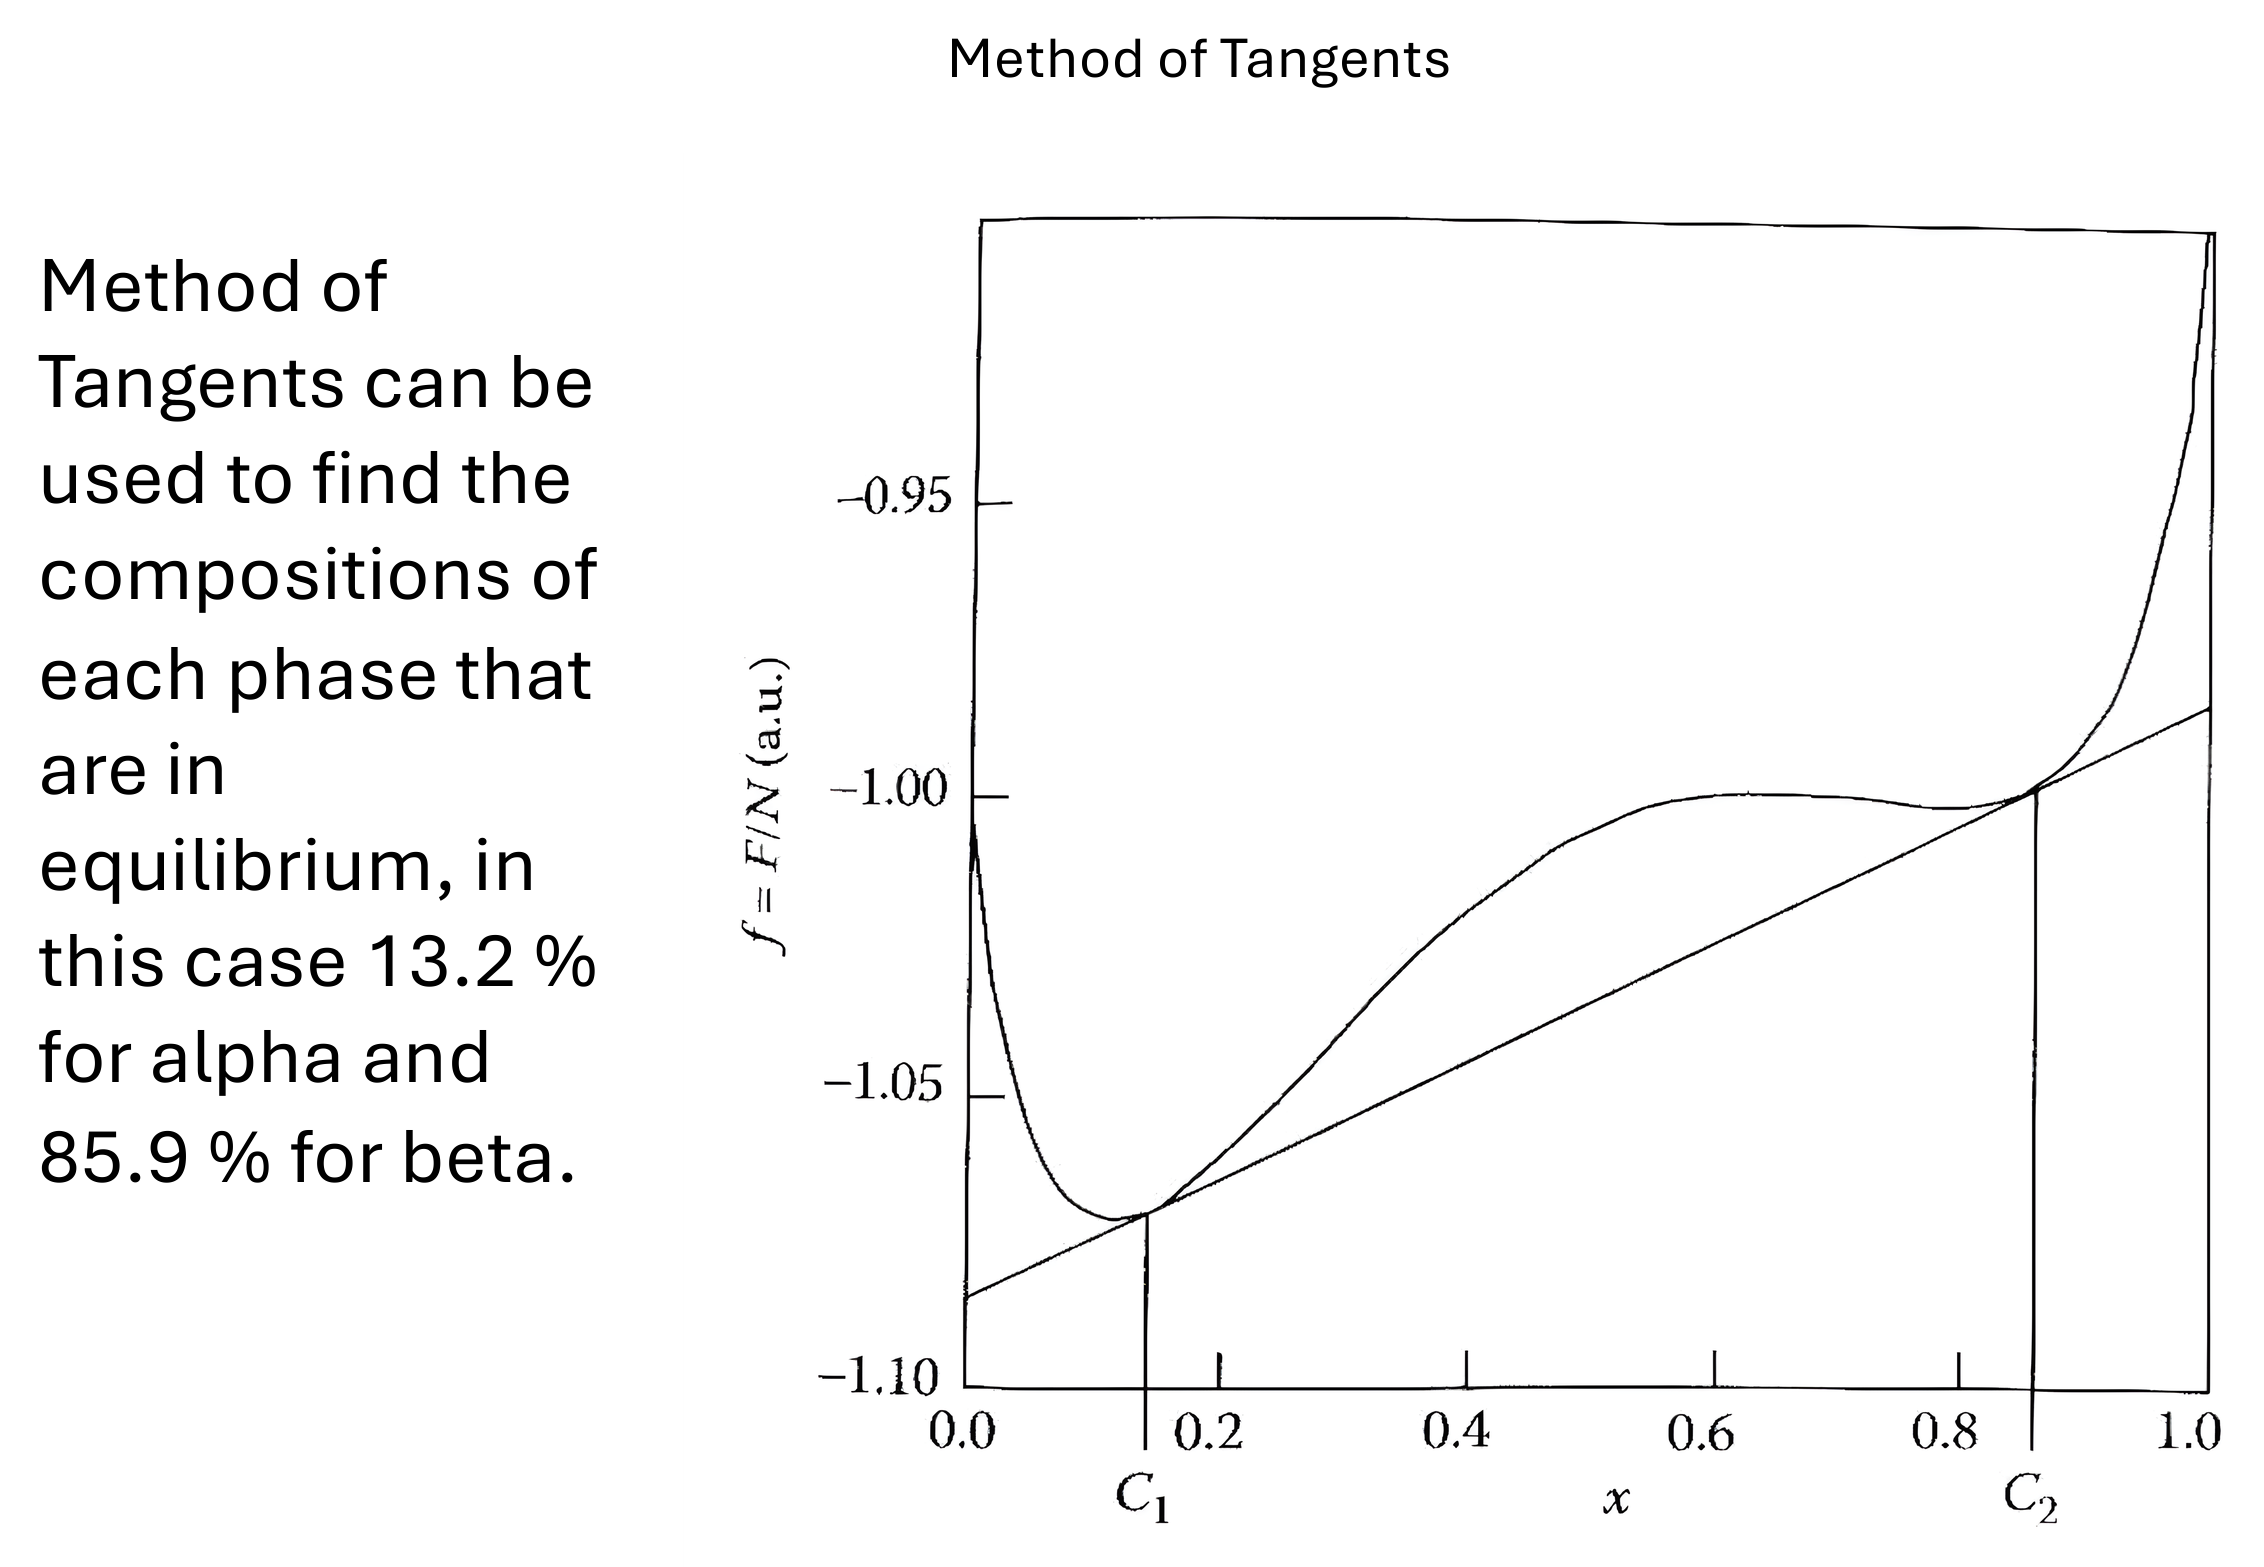
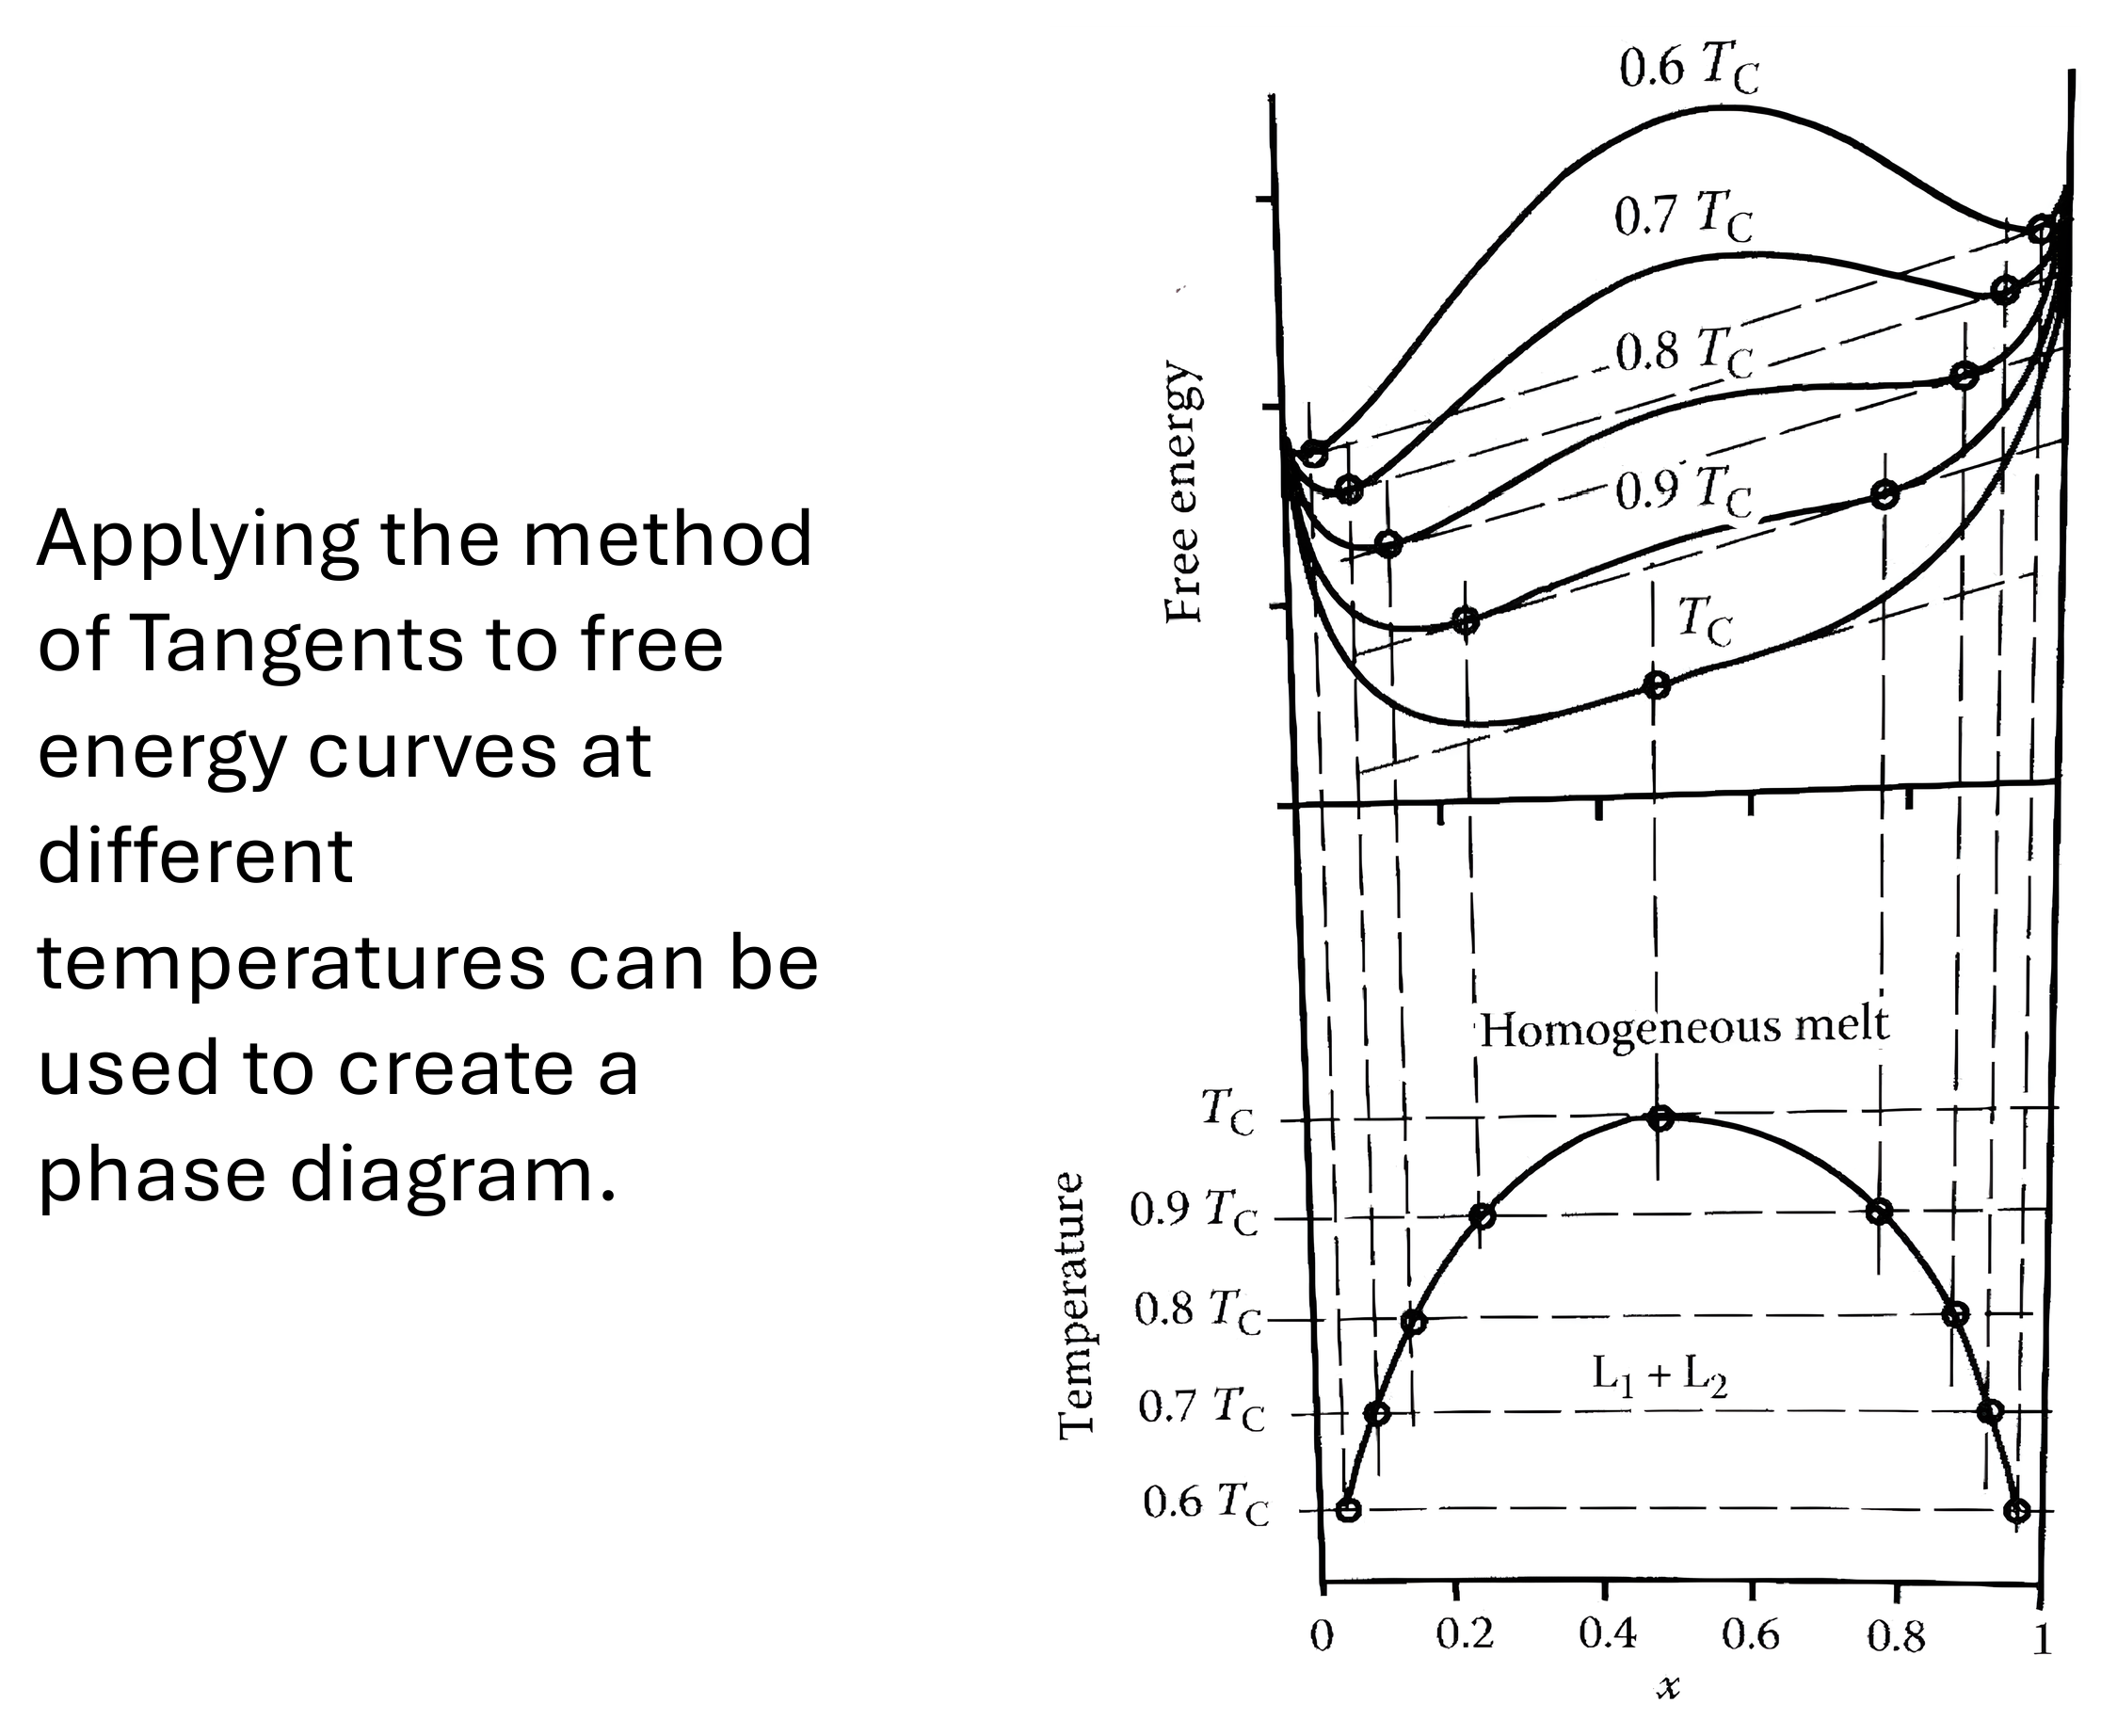
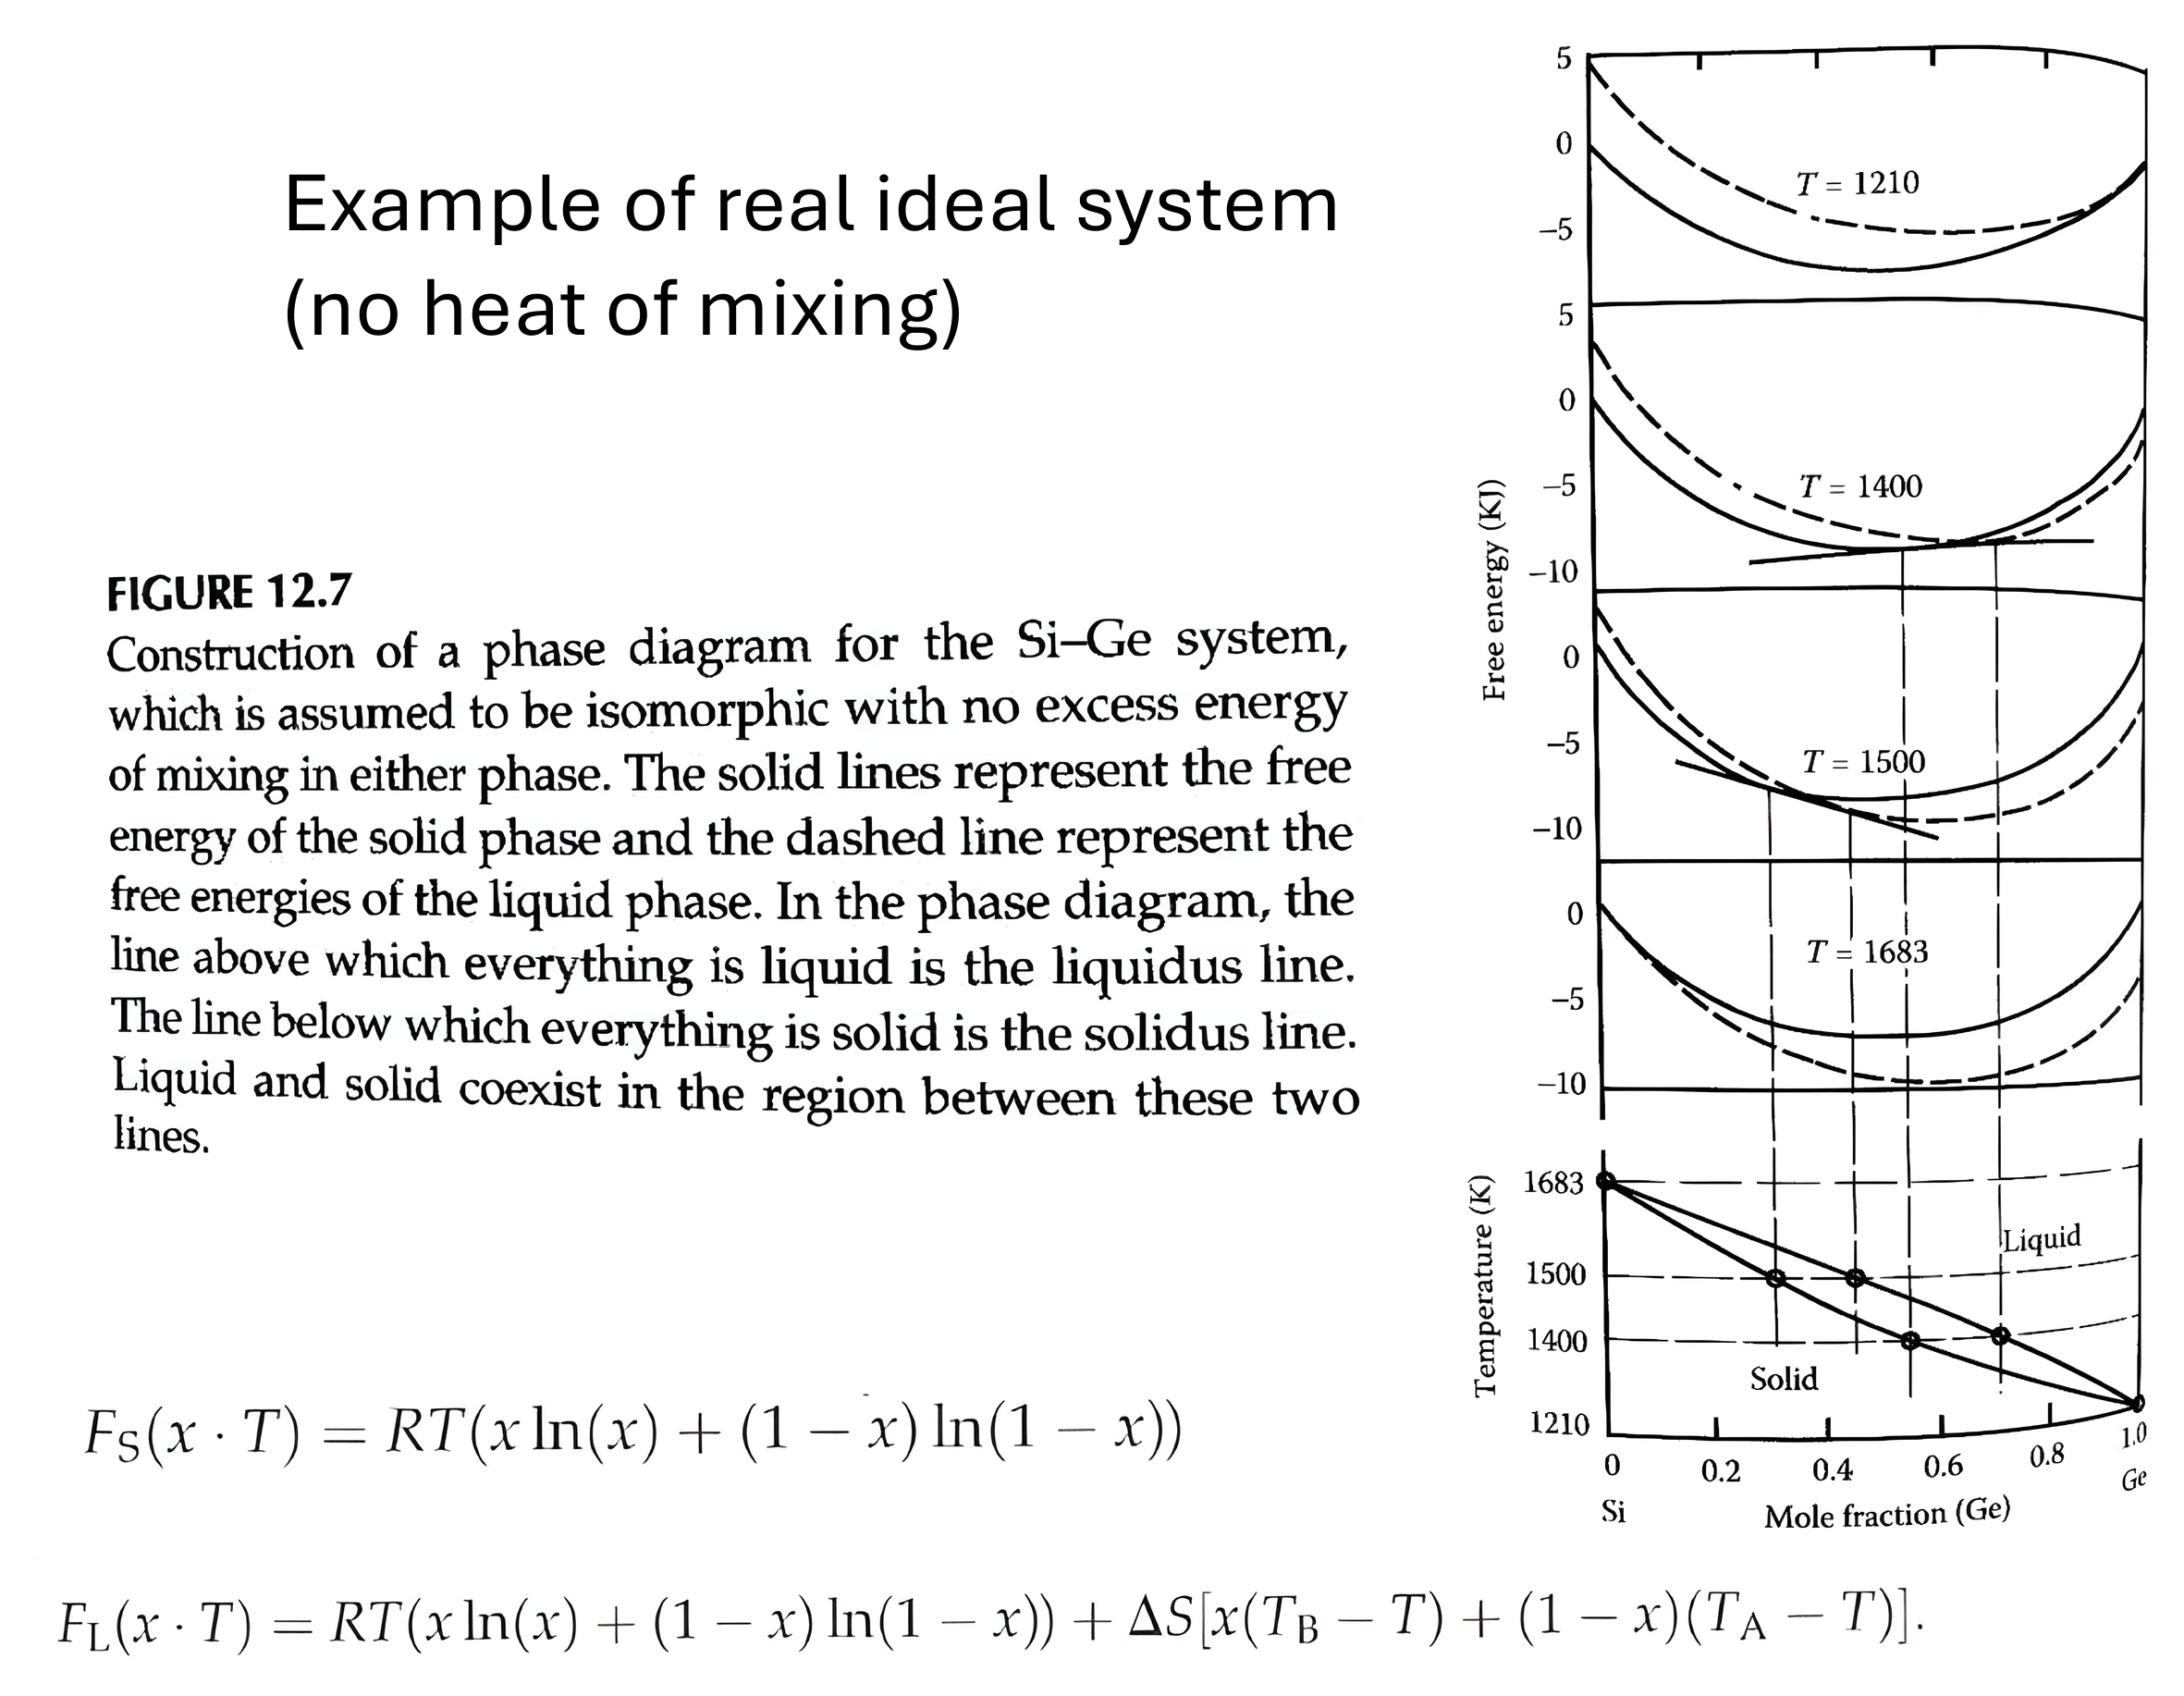
Practice questions
Work the Lecture 10 practice questions before the next class. They cover binary diagrams with intermediate compounds, congruent and incongruent melting, reading a ternary triangle, the triangle (lever) rule, and building a phase diagram from free-energy curves and common tangents.
Open the Lecture 10 practice questions
Every question carries a worked explanation, so you can check your reasoning as you go.