CHEM 548: Materials Chemistry

Lecture 9: Solid Solutions and Vegard's Law

Wed 09/23/2026

Solid solutions, Vegard's law and its deviations, and band-gap engineering

Reading: Woodward, Karen, Evans, and Vogt, Solid State Materials Chemistry
Ch. 2 §2.5 · Ch. 4 §§4.1–4.2

Solid Solutions and Vegard's Law

Learning Objectives

  • Define a solid solution and compare to liquid solutions.
  • State Vegard's law: unit cell dimensions (and some properties) vary linearly with composition.
  • Apply Vegard's law to calculate lattice parameters and band gaps of intermediate compositions.
  • Recognize and explain deviations from Vegard's law:
    • Charge transfer (e.g., Mn³⁺/Ru⁵⁺ in Ca-based perovskites).
    • Ordering of different-size ions → more efficient packing.
  • Appreciate the importance of solid solutions in semiconductors (epitaxy, heterojunction lasers, LEDs).
  • Use Vegard's law to estimate composition from property measurements (e.g., lattice constant, band gap).

Vegard's Law
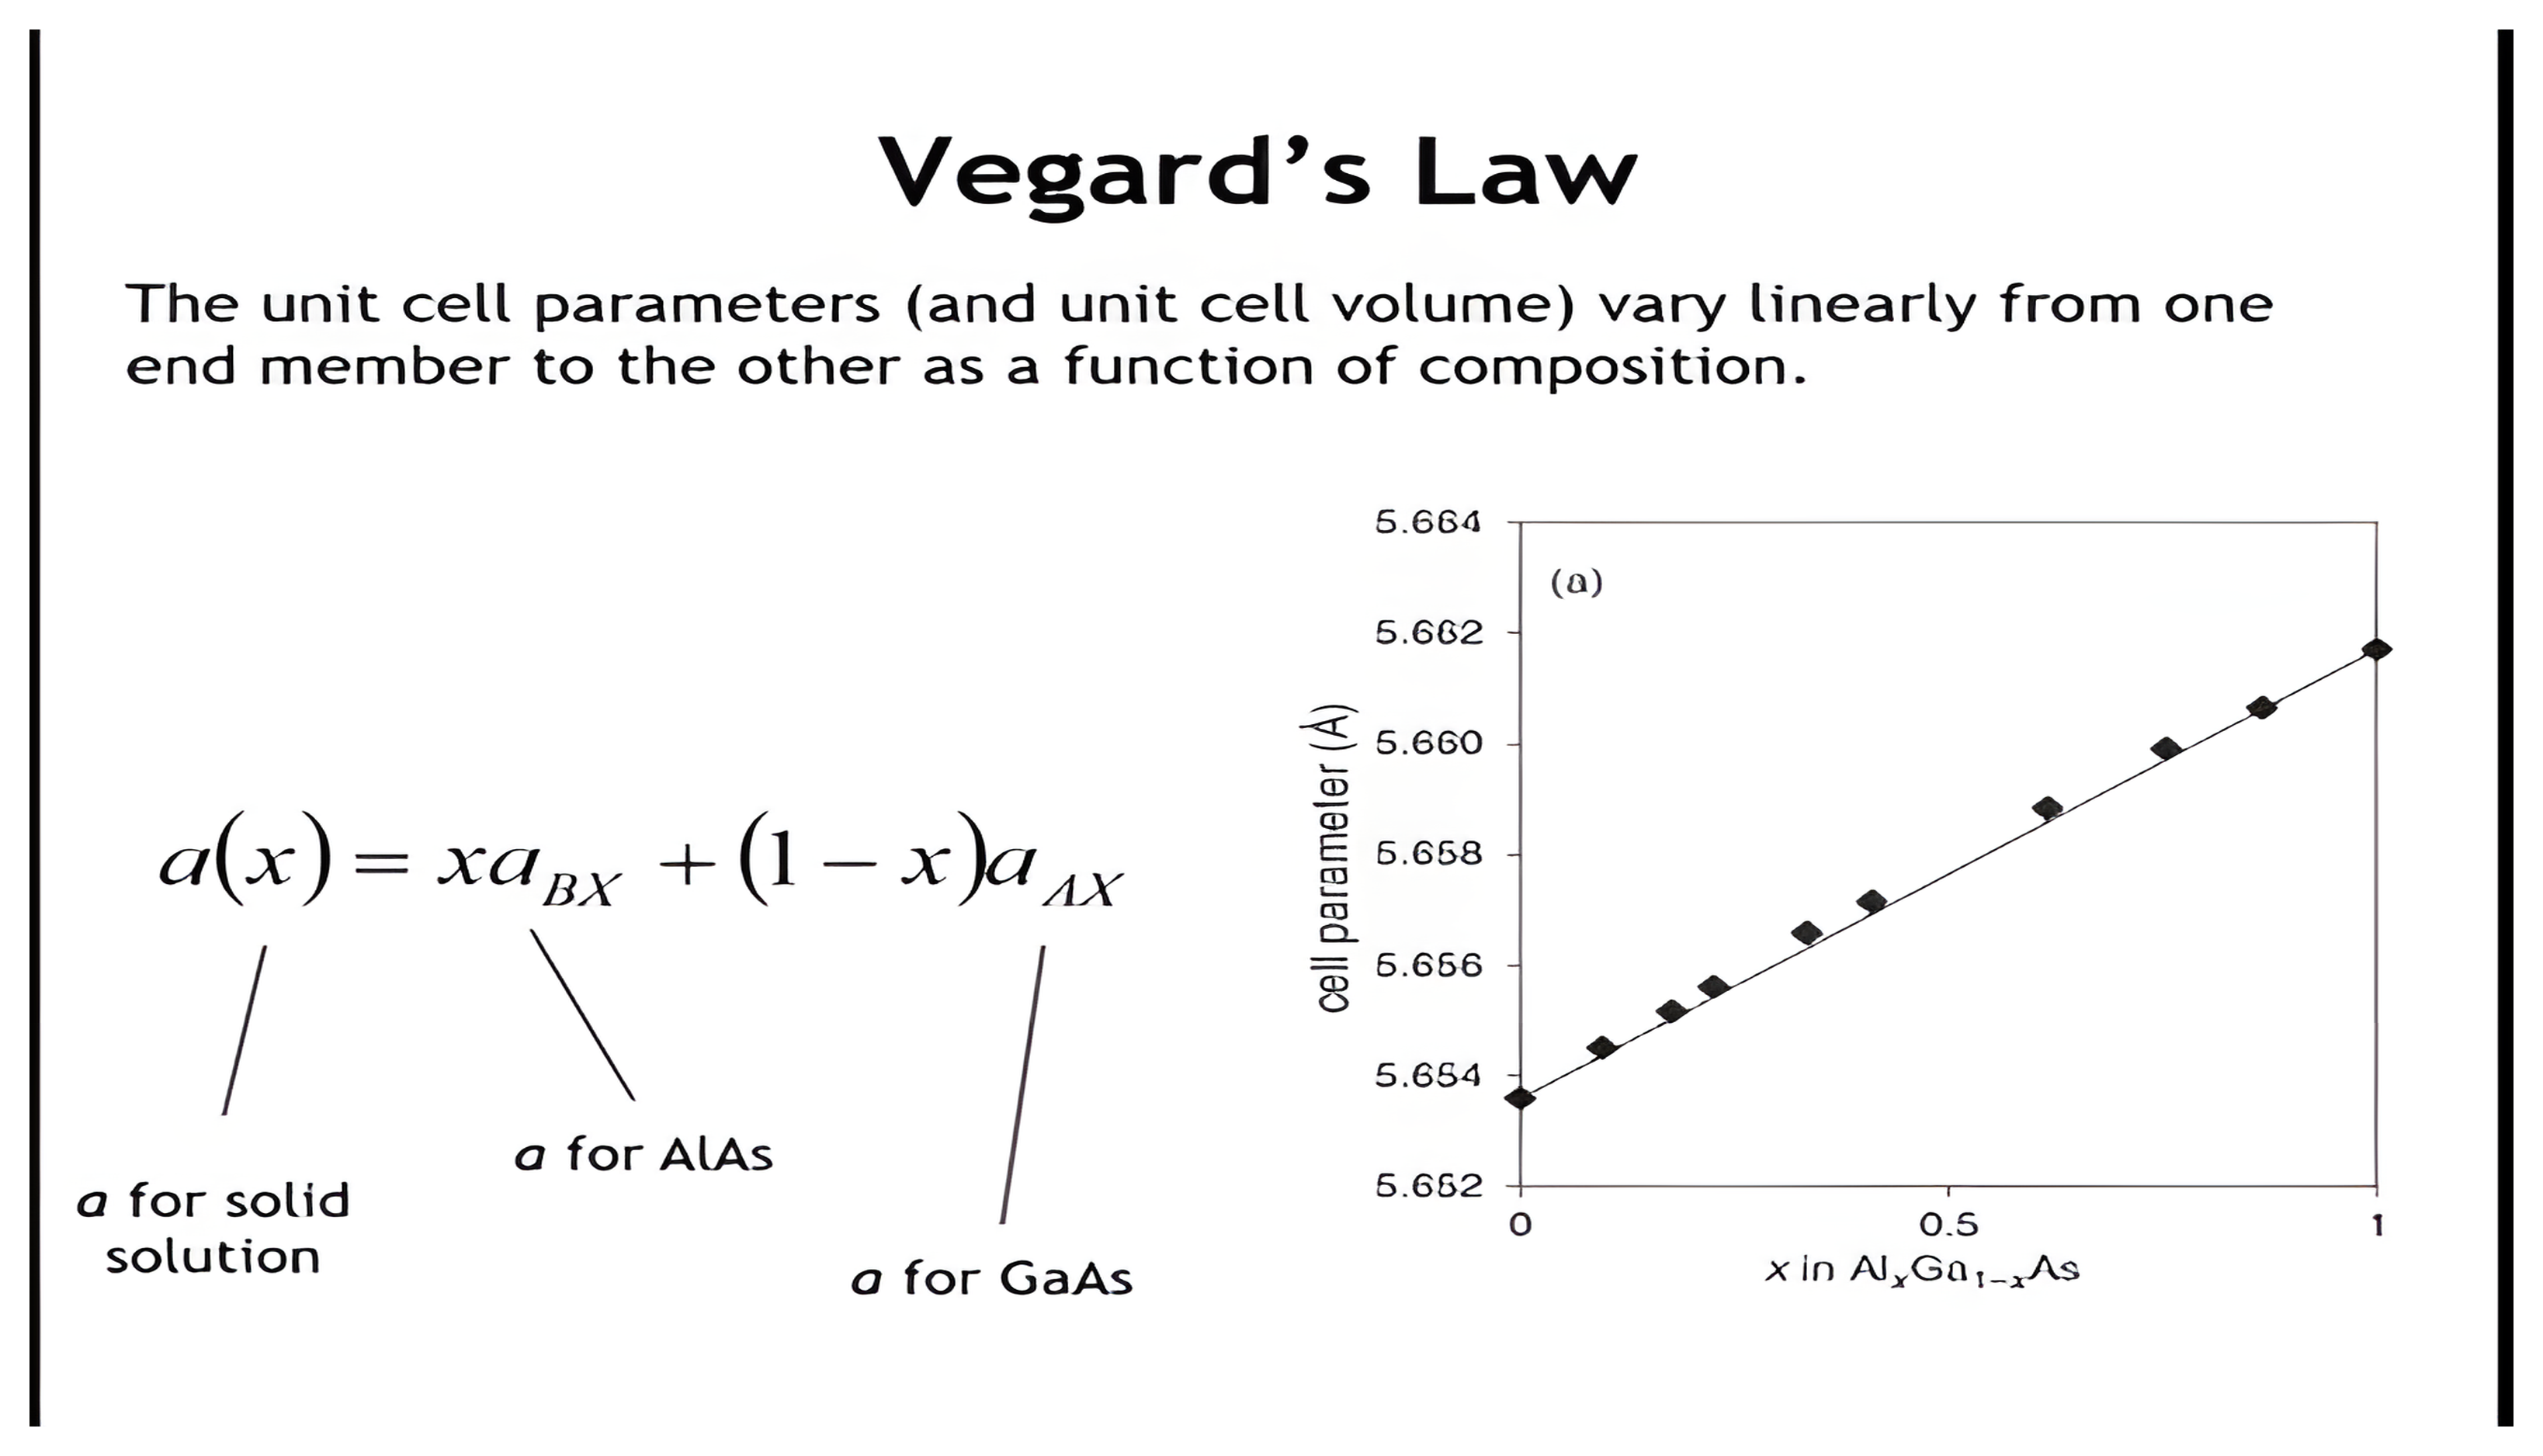
Vegard's law shown as a linear lattice-parameter equation and a linear cell-parameter plot for the aluminum arsenide and gallium arsenide solid solution.

$a(x) = x\,a_{BX} + (1-x)\,a_{AX}$

Deviations from Vegard's Law
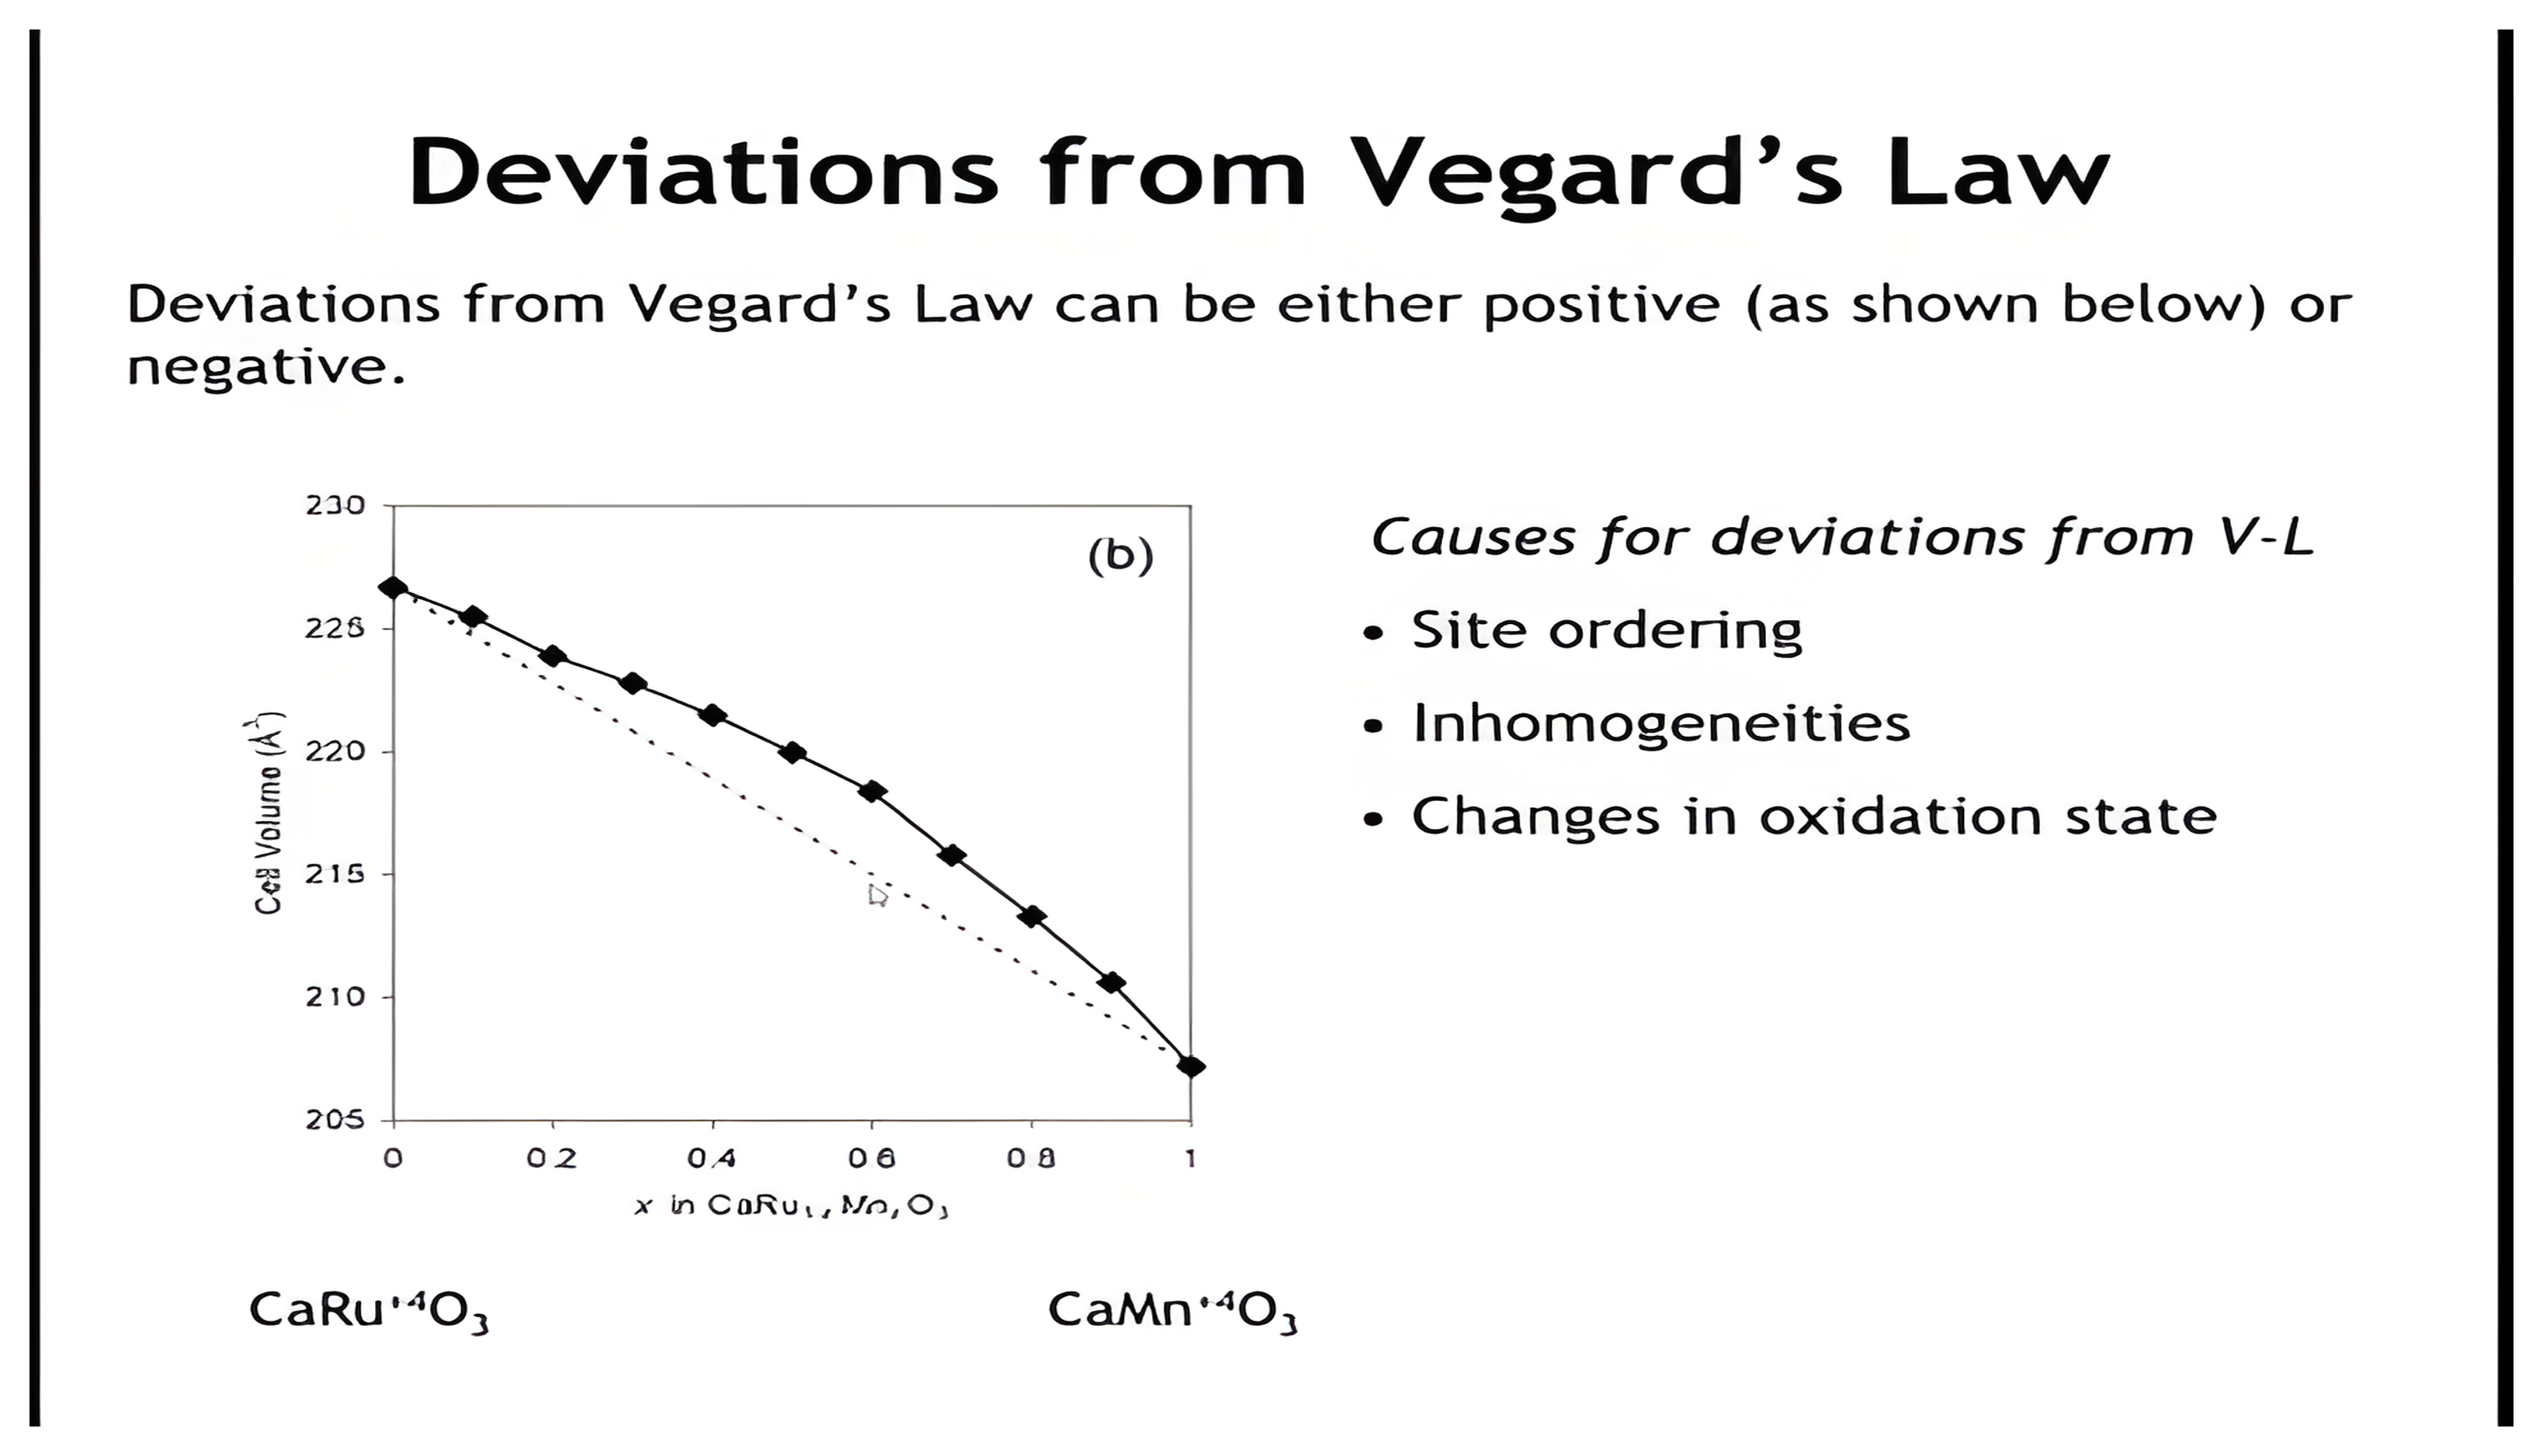
A positive deviation from the linear Vegard's-law line in the calcium ruthenate and calcium manganate solid solution, with causes listed.

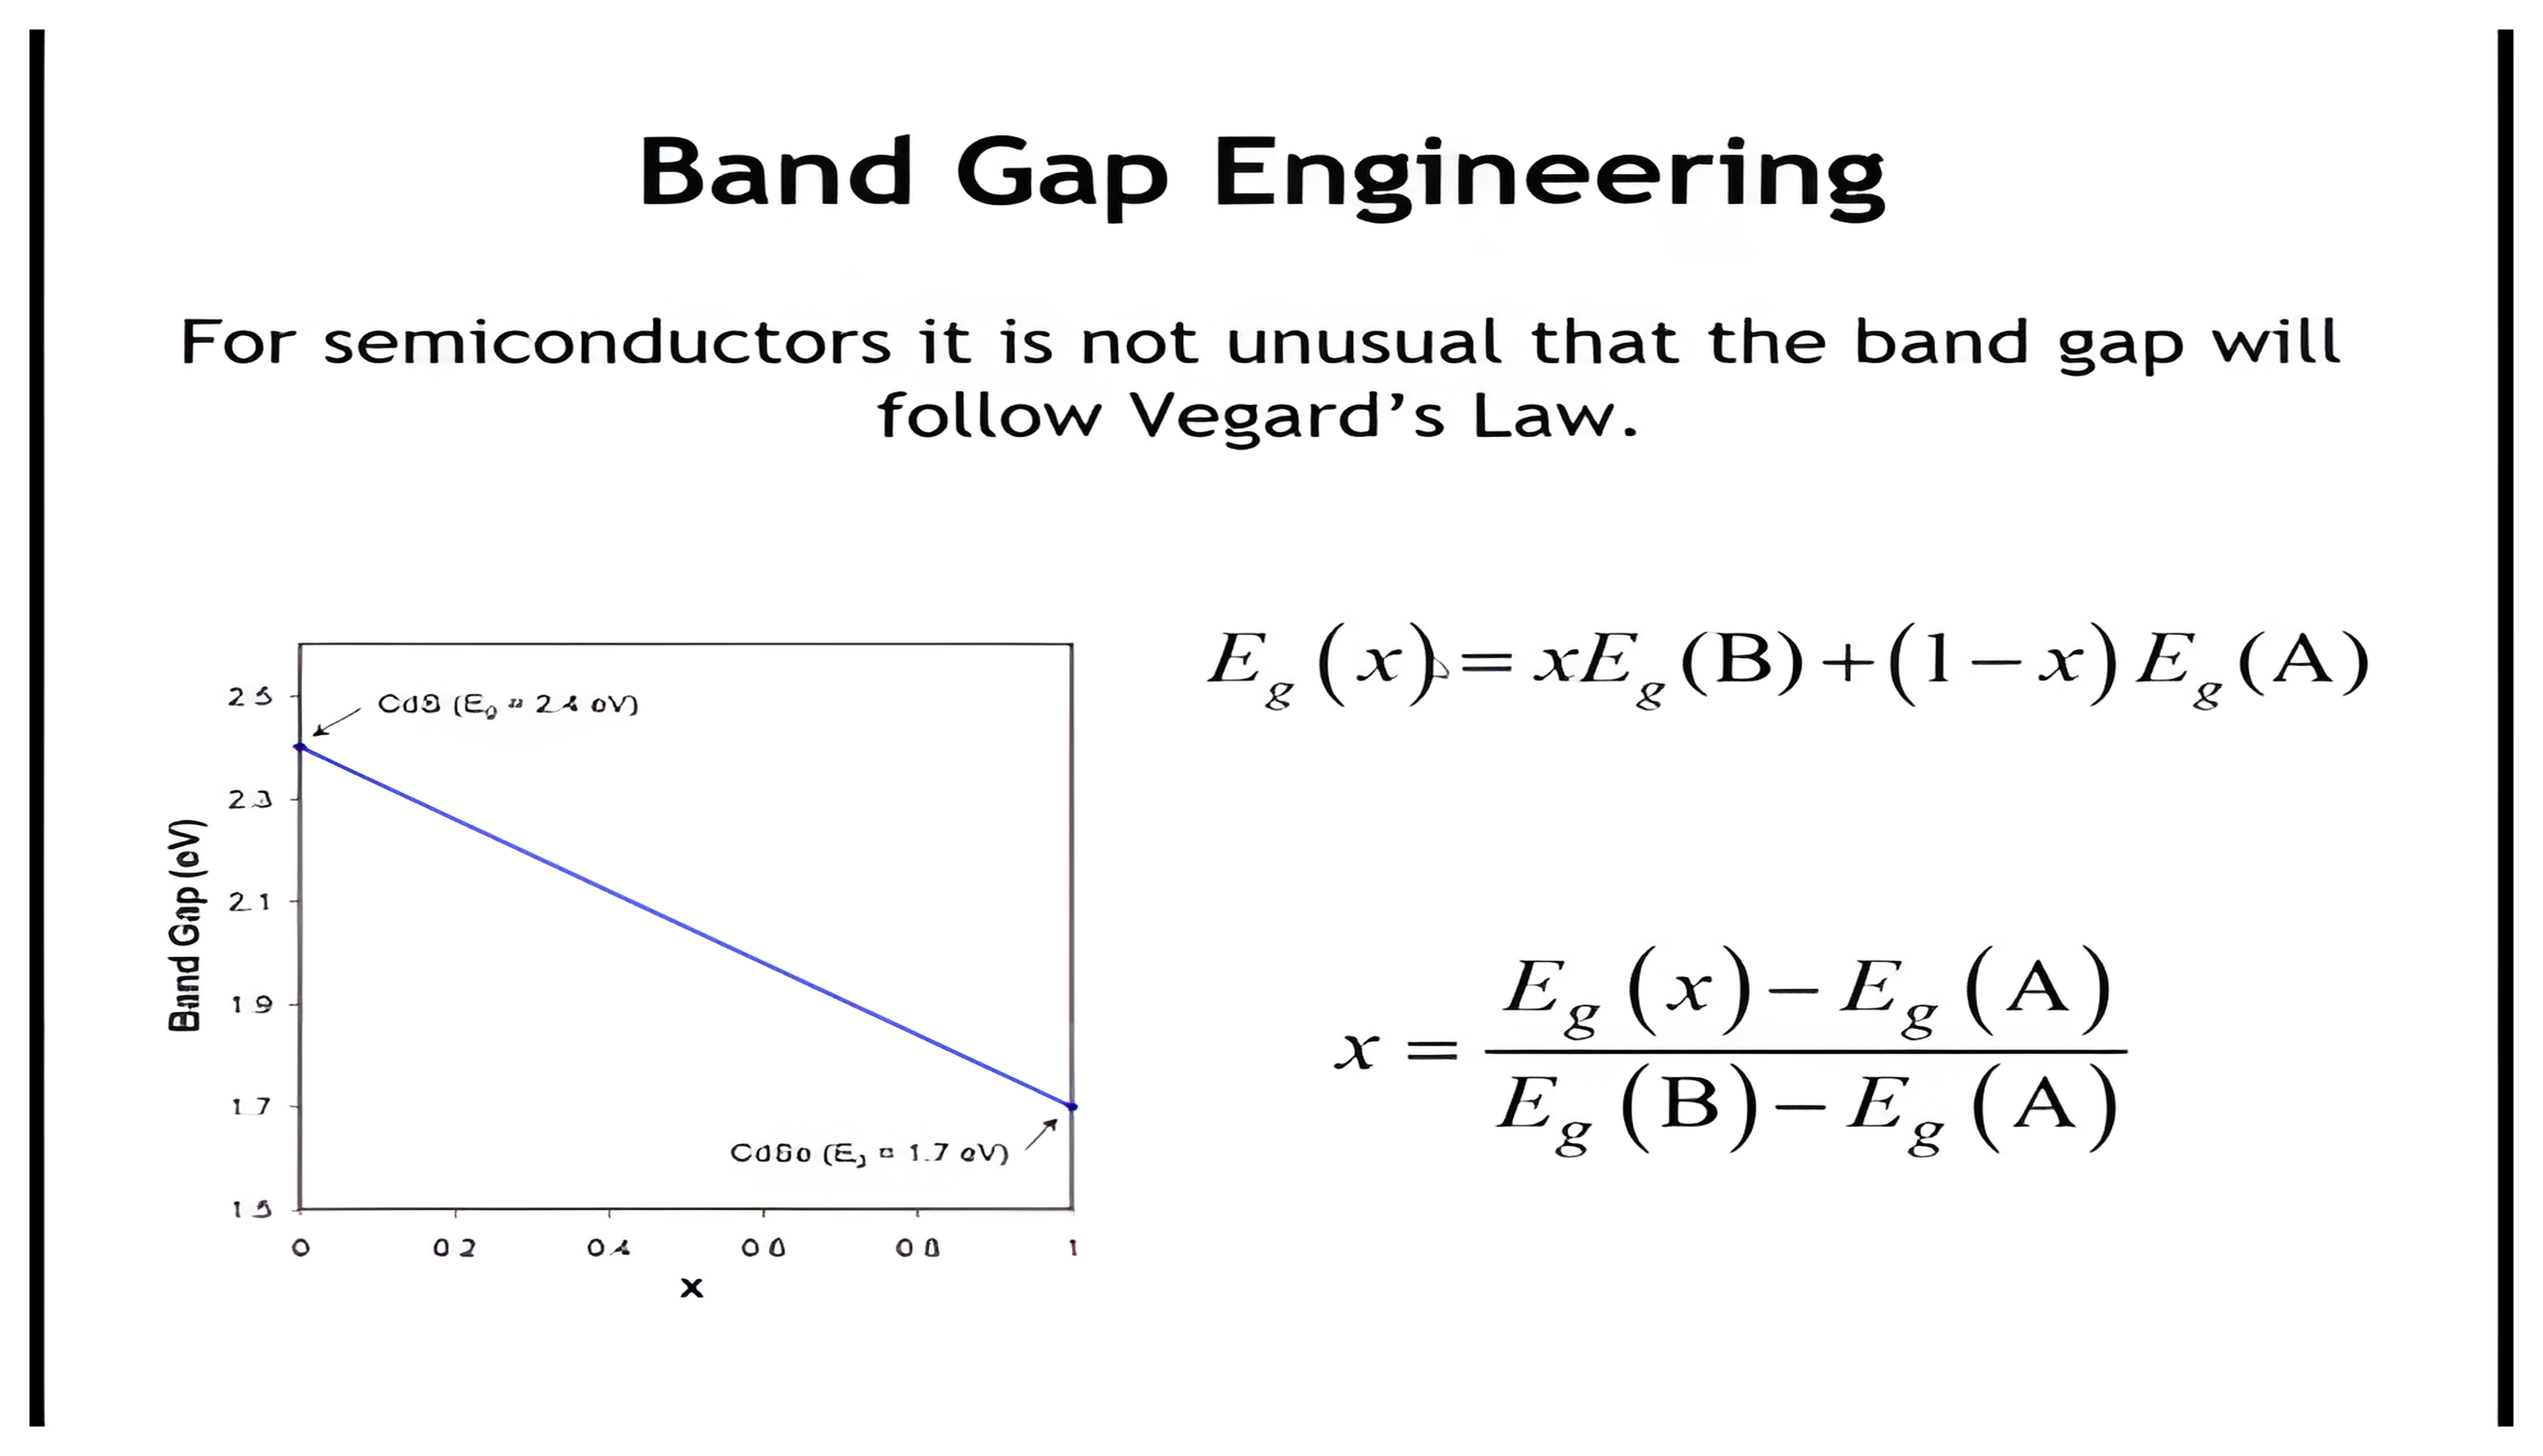
Band Gap Engineering

A linear band-gap relation between CdS and CdSe with equations for predicting band gap and composition.

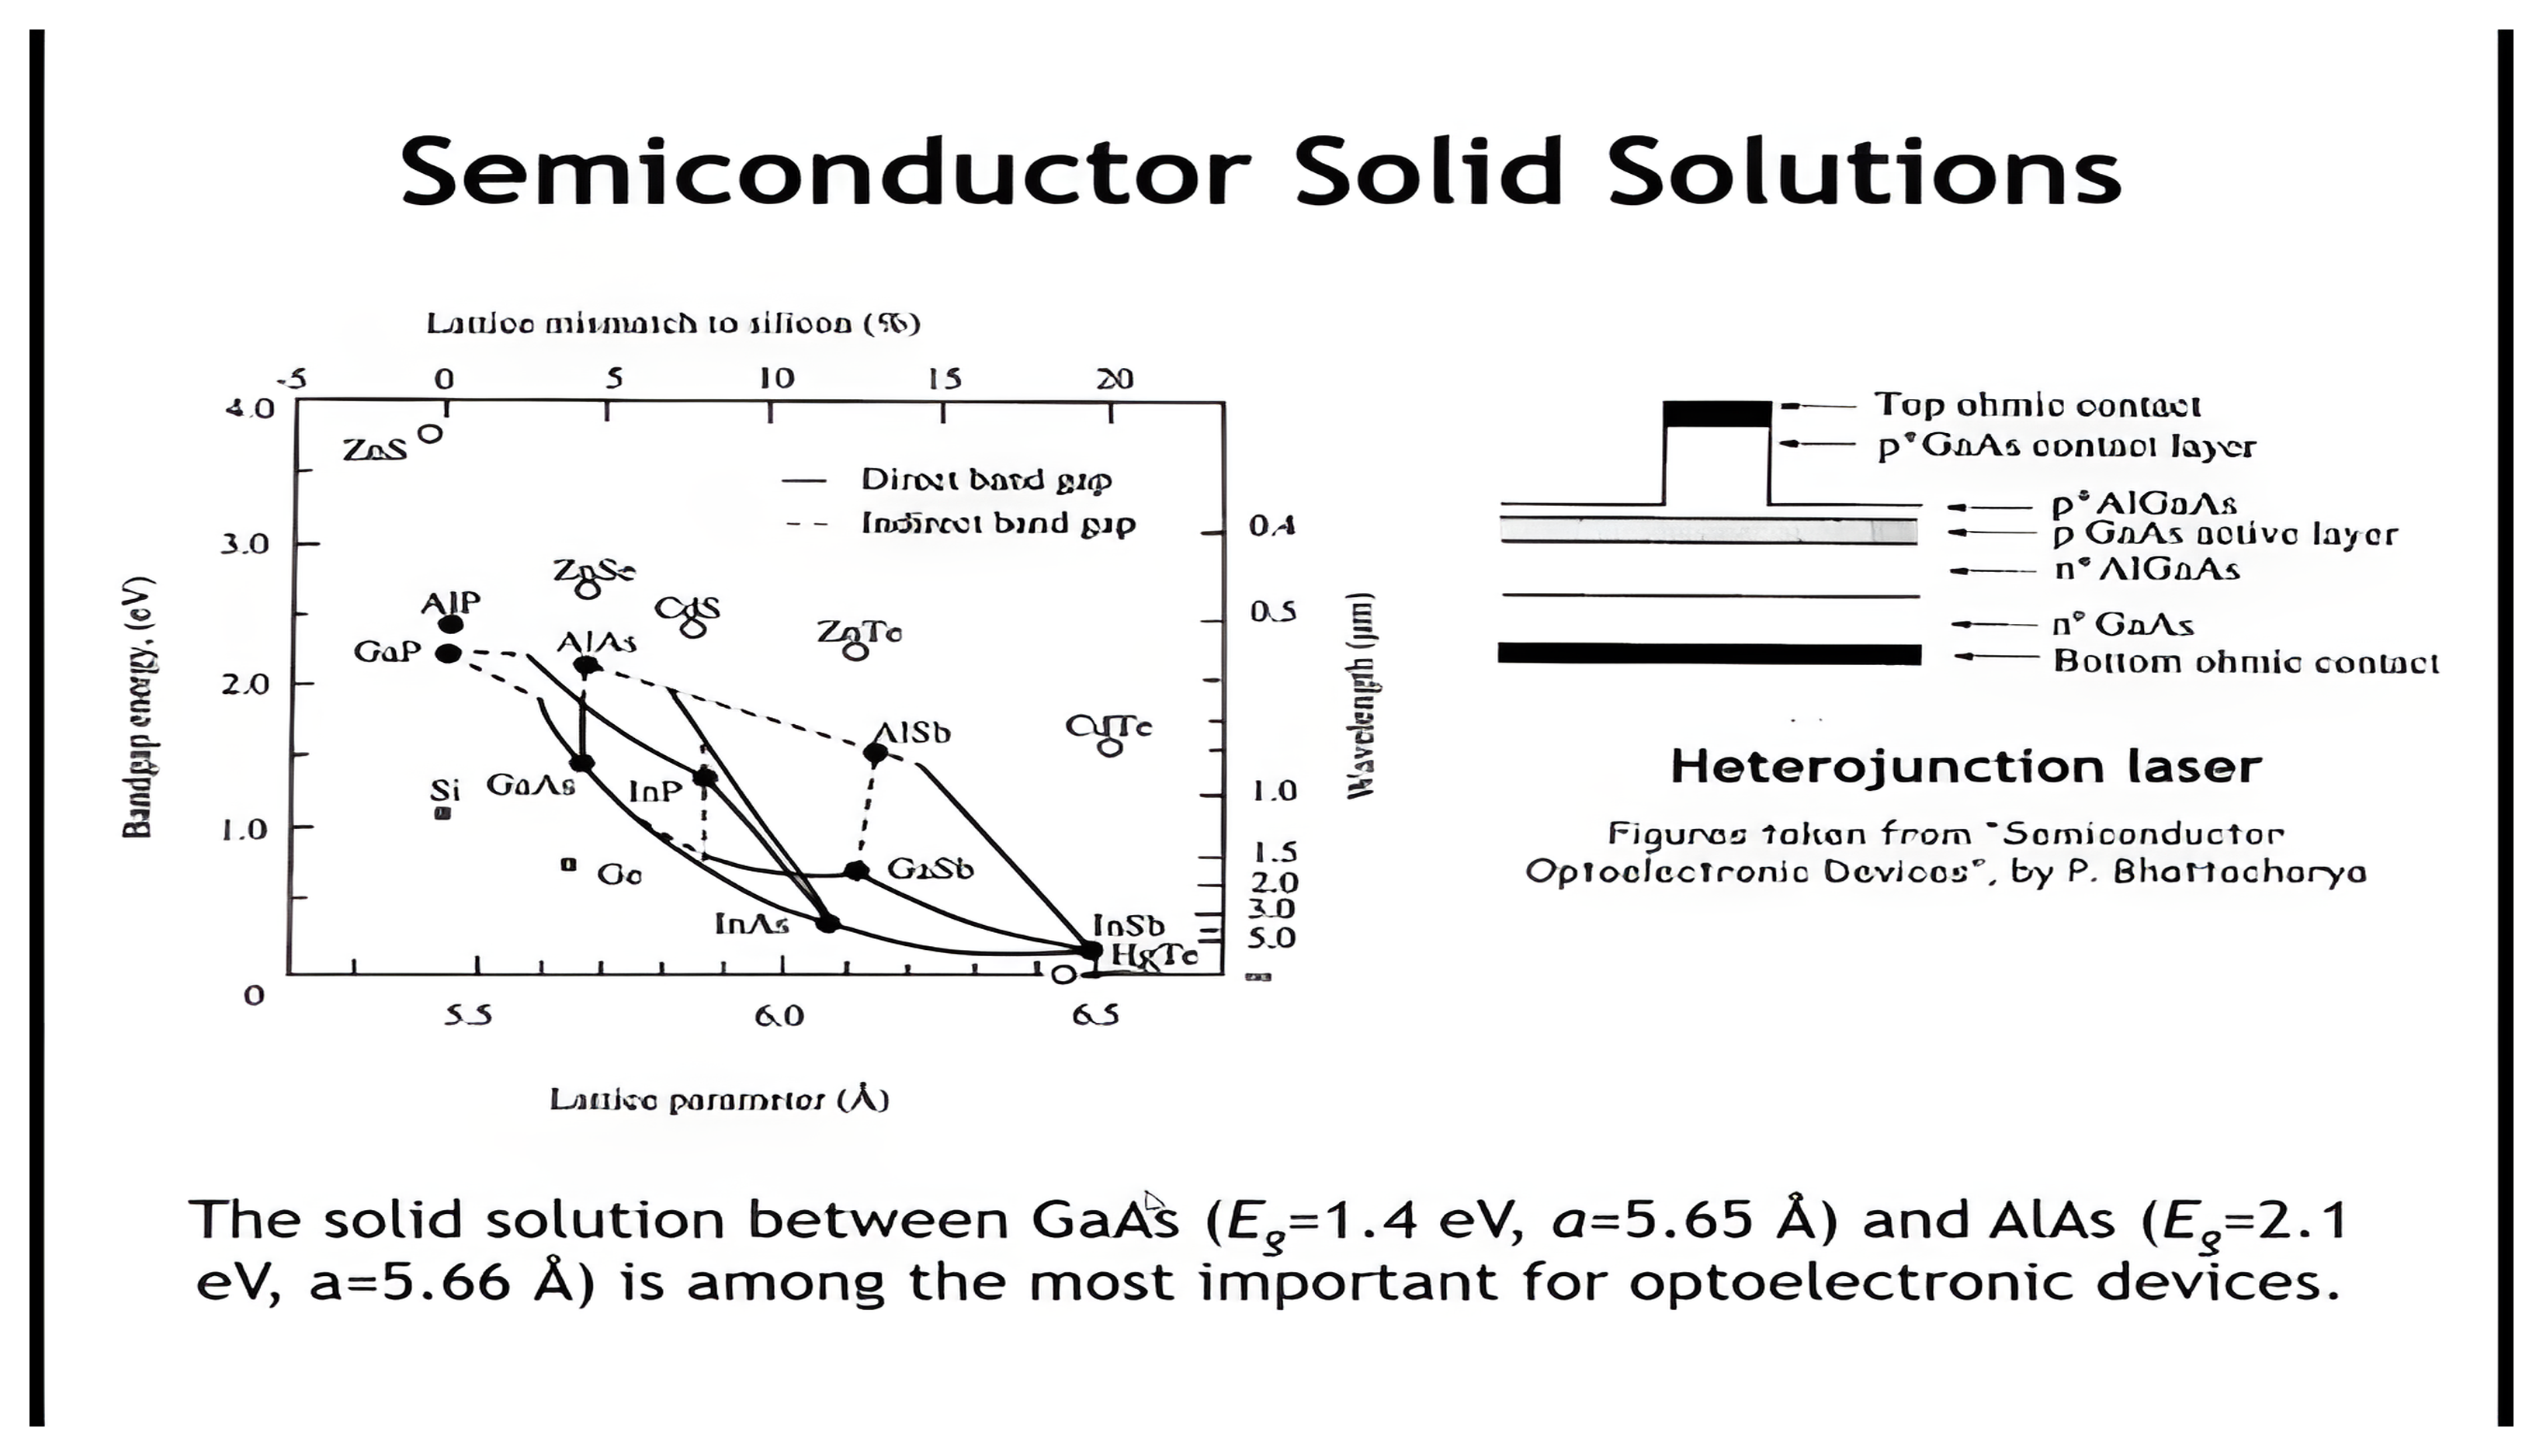
Semiconductor Solid Solutions

Band-gap versus lattice-parameter map beside a heterojunction-laser layer schematic for semiconductor solid solutions.

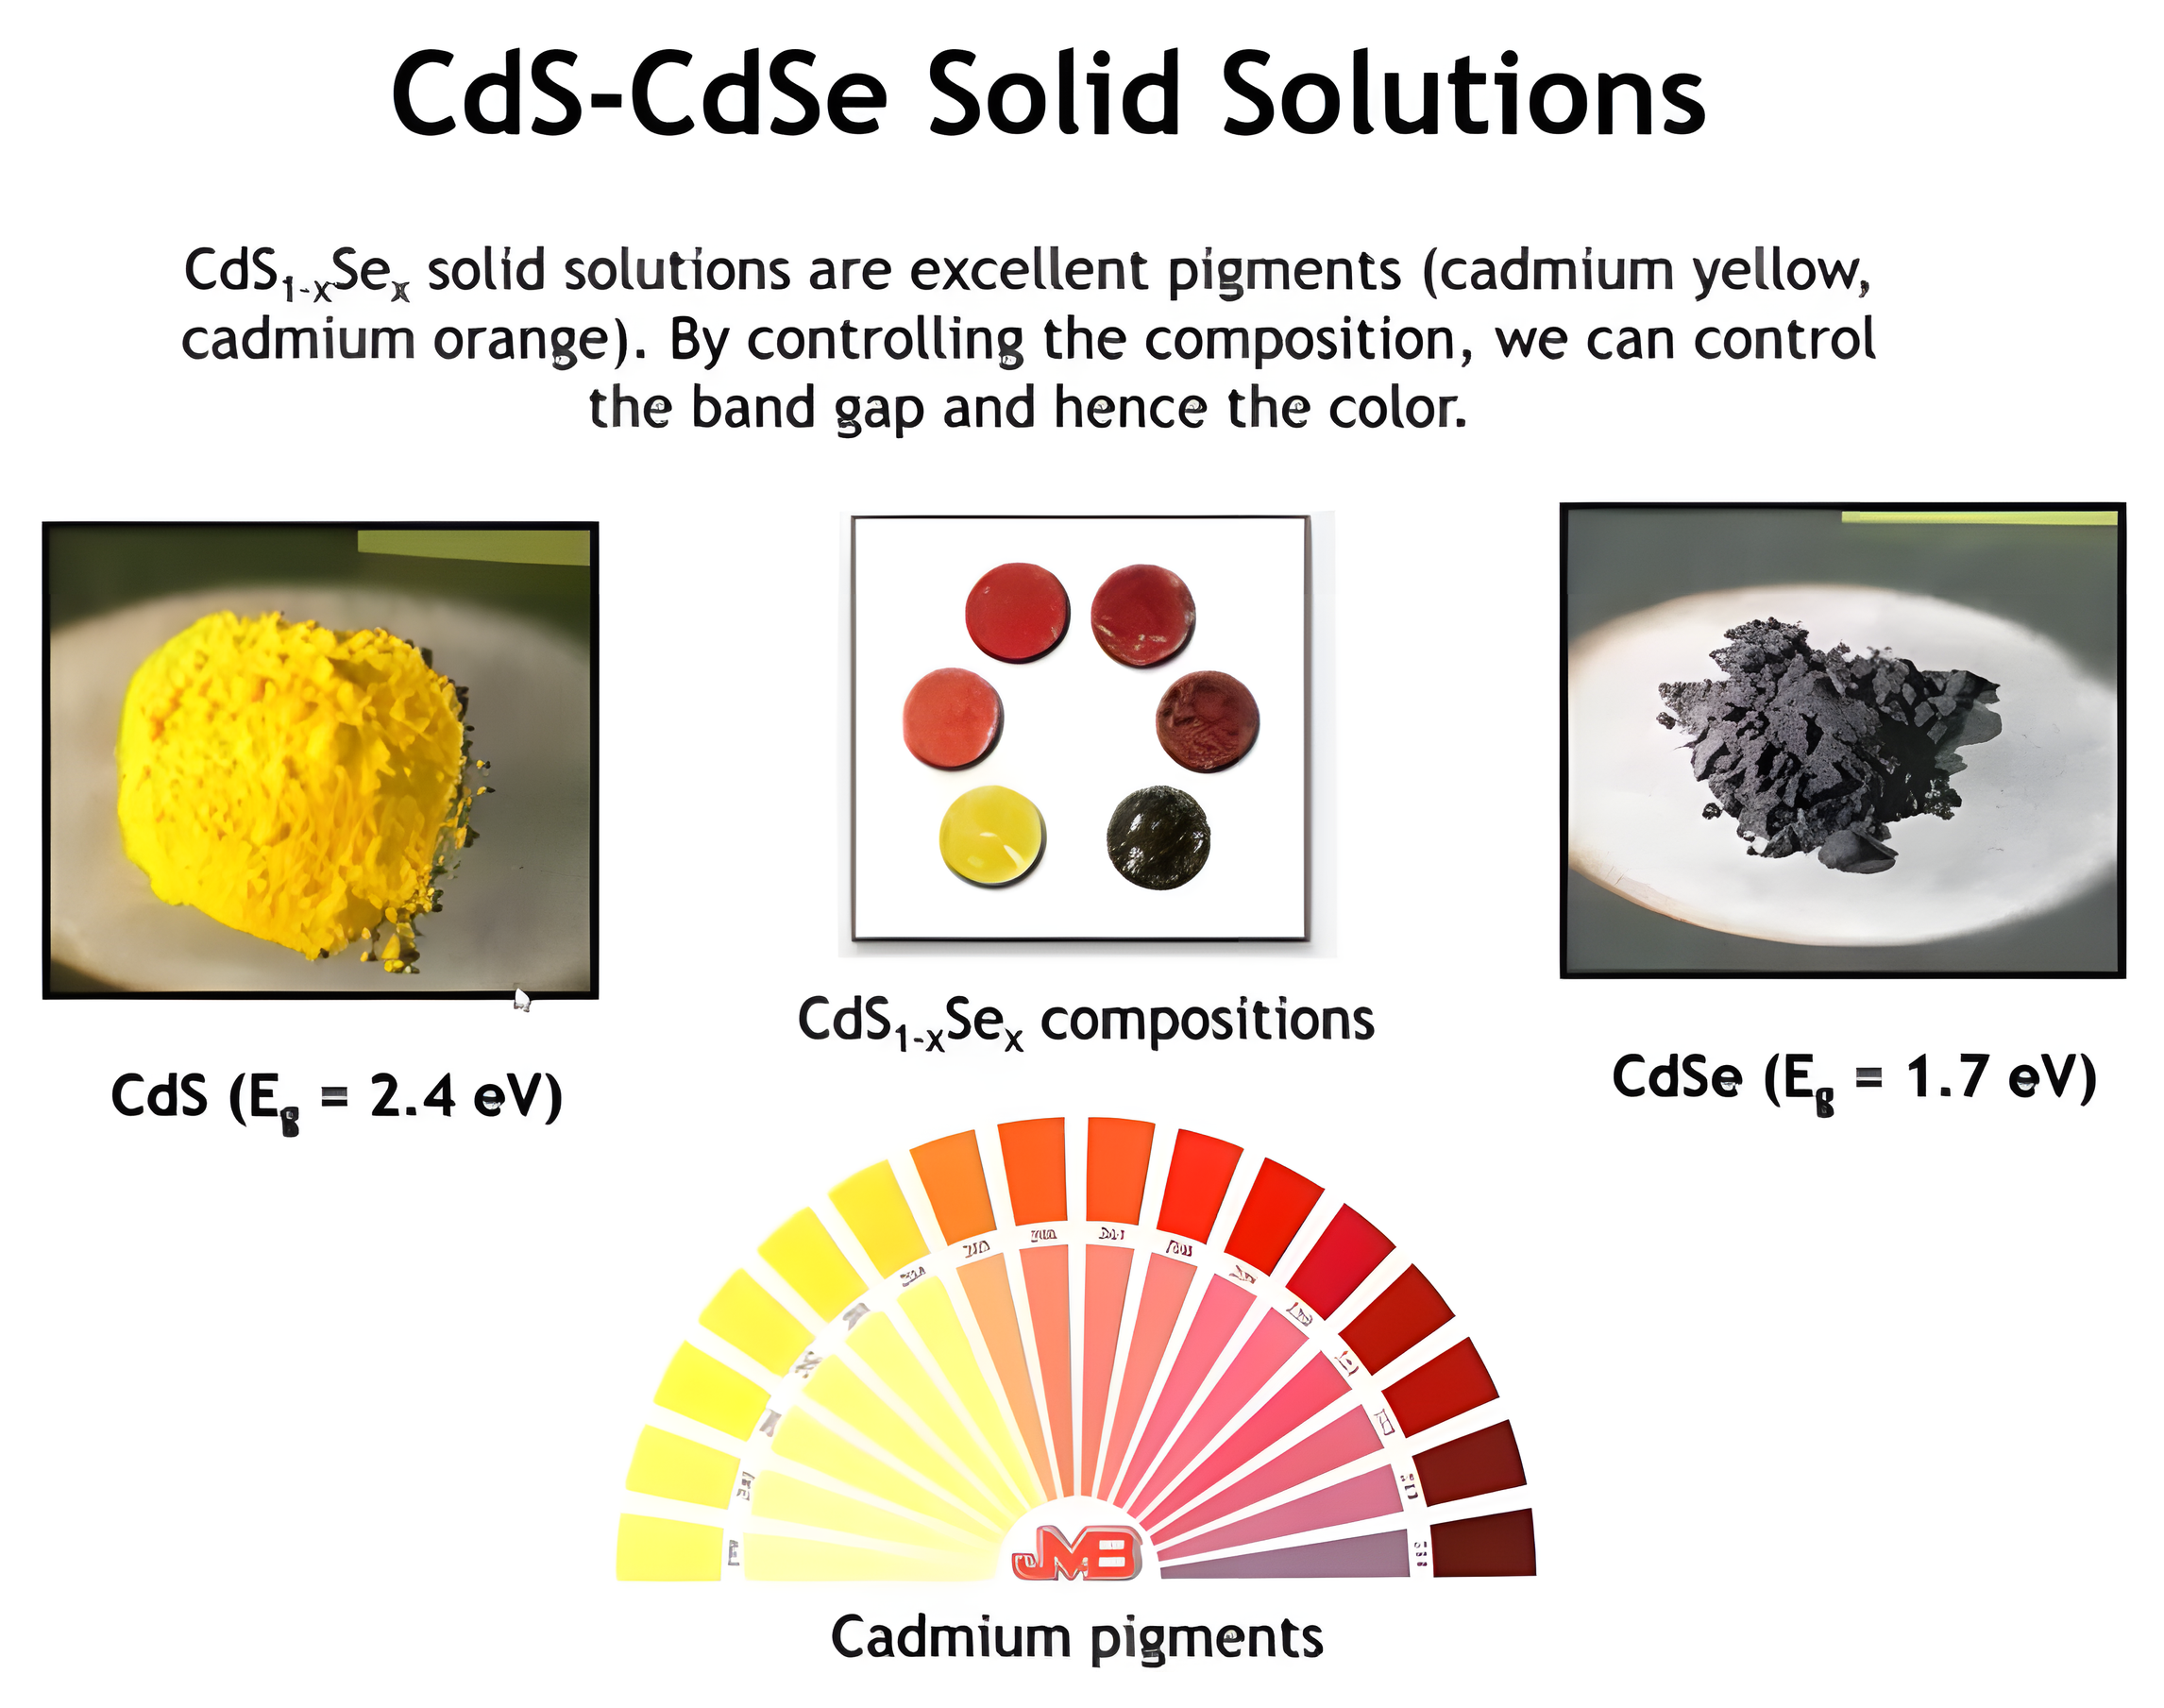
CdS-CdSe Solid Solutions

Cadmium sulfide to cadmium selenide pigments ranging from yellow through orange and red to nearly black.

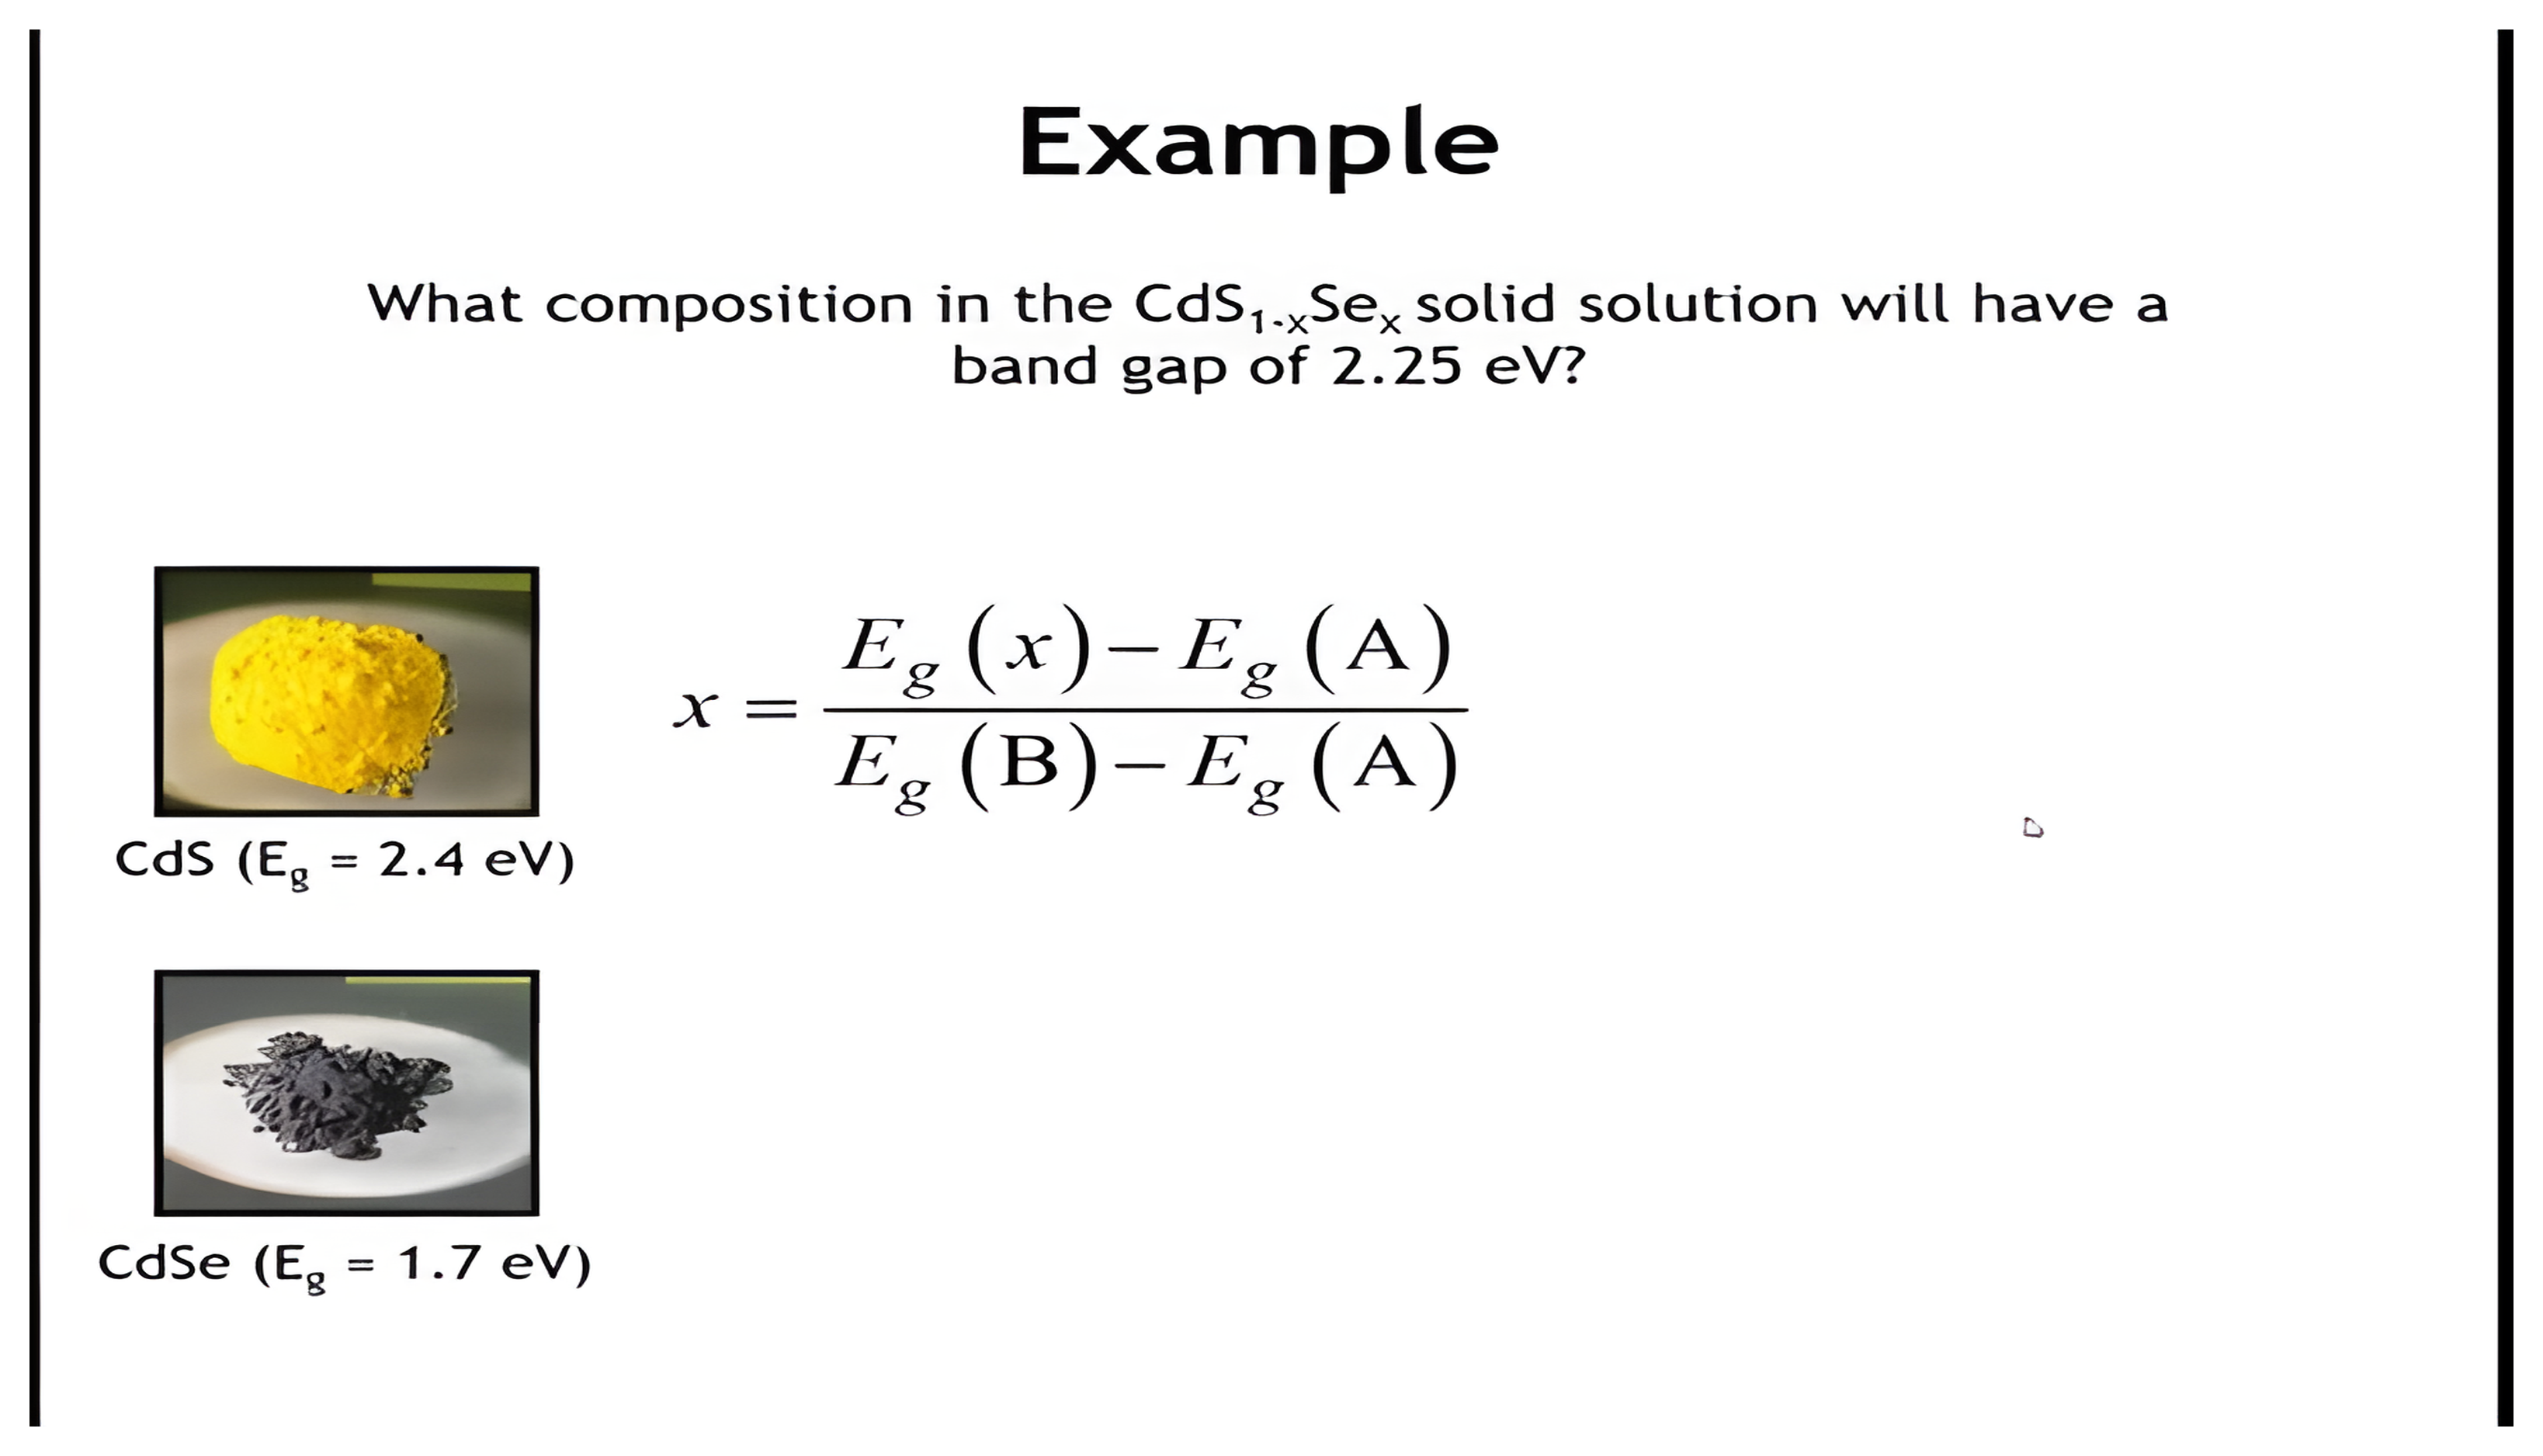
Example: Orange CdS-CdSe

Worked example asking which CdS-CdSe composition has a 2.25 electron-volt band gap; advancing reveals the composition calculation and the band-gap graph.

Composition calculation

Band-gap graph

Summary

  • Solid solutions: homogeneous crystals spanning compositions between two end members.
  • Vegard's law: lattice constant (and sometimes other properties) varies linearly with composition.
  • Deviations occur due to charge transfer or cation/anion ordering, leading to positive or negative curvature.
  • Many semiconductor properties (e.g., band gap) also approximate Vegard's law, enabling band gap engineering.
  • Applications:
    • GaAs–AlAs: nearly constant lattice parameter but tunable band gap → key for epitaxial devices (lasers, LEDs).
    • CdS–CdSe: tunable band gap controls pigment color (yellow → red → black).
  • Practical use: Vegard's law lets us predict composition from structure or property measurements.

Why phase diagrams
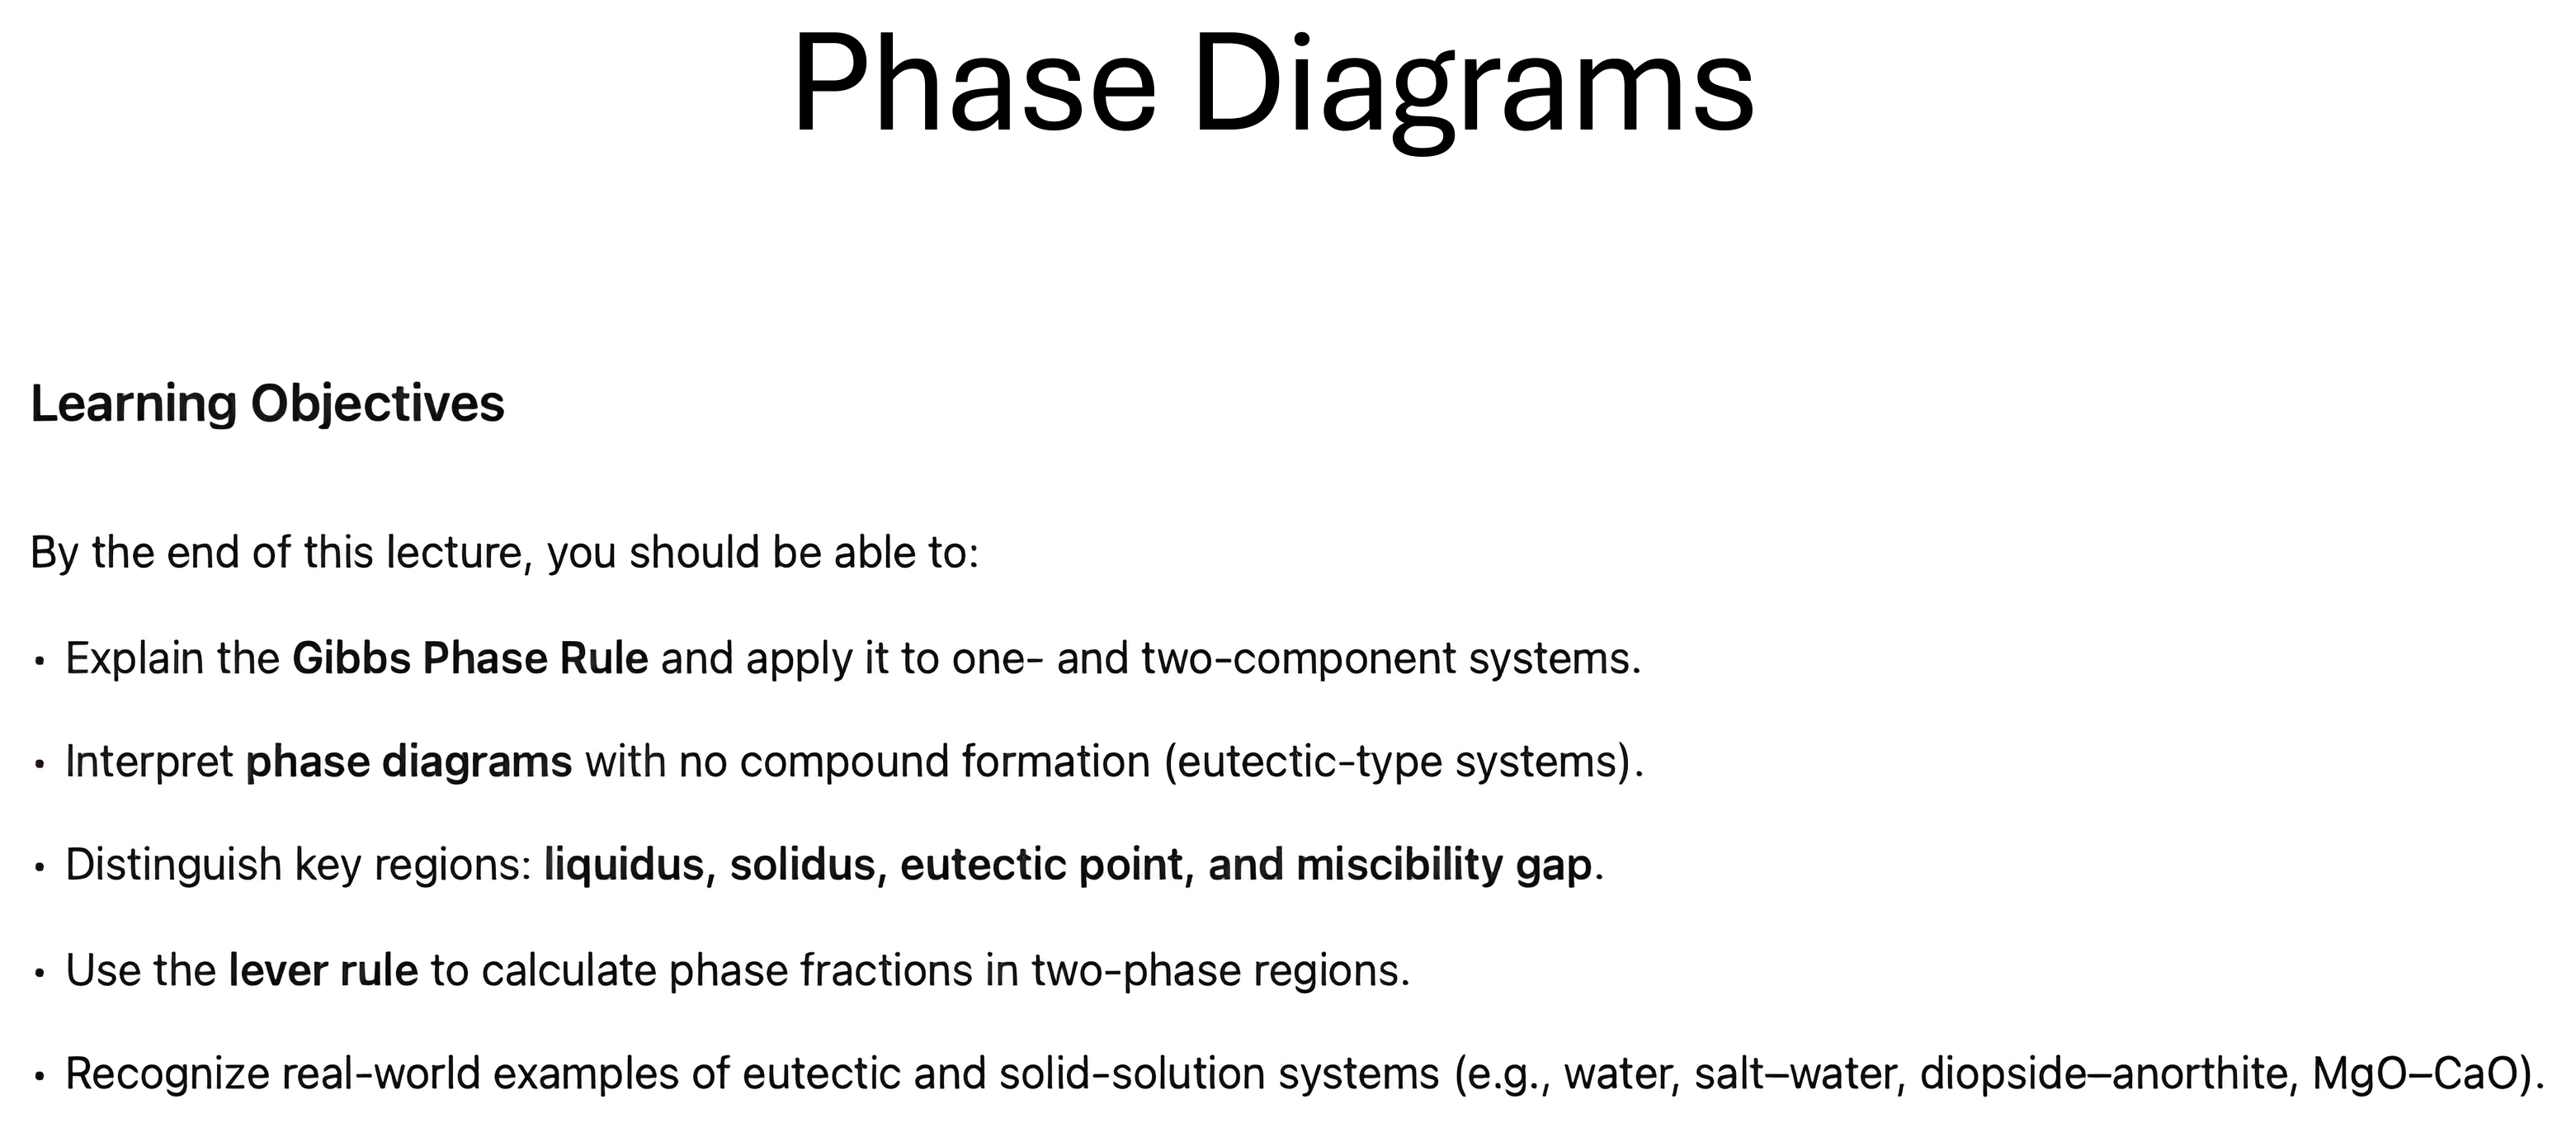
Opening page for phase diagrams, listing the learning objectives: the Gibbs phase rule, reading a eutectic diagram, the liquidus, solidus, eutectic point and miscibility gap, the lever rule, and real examples.

The Gibbs phase rule

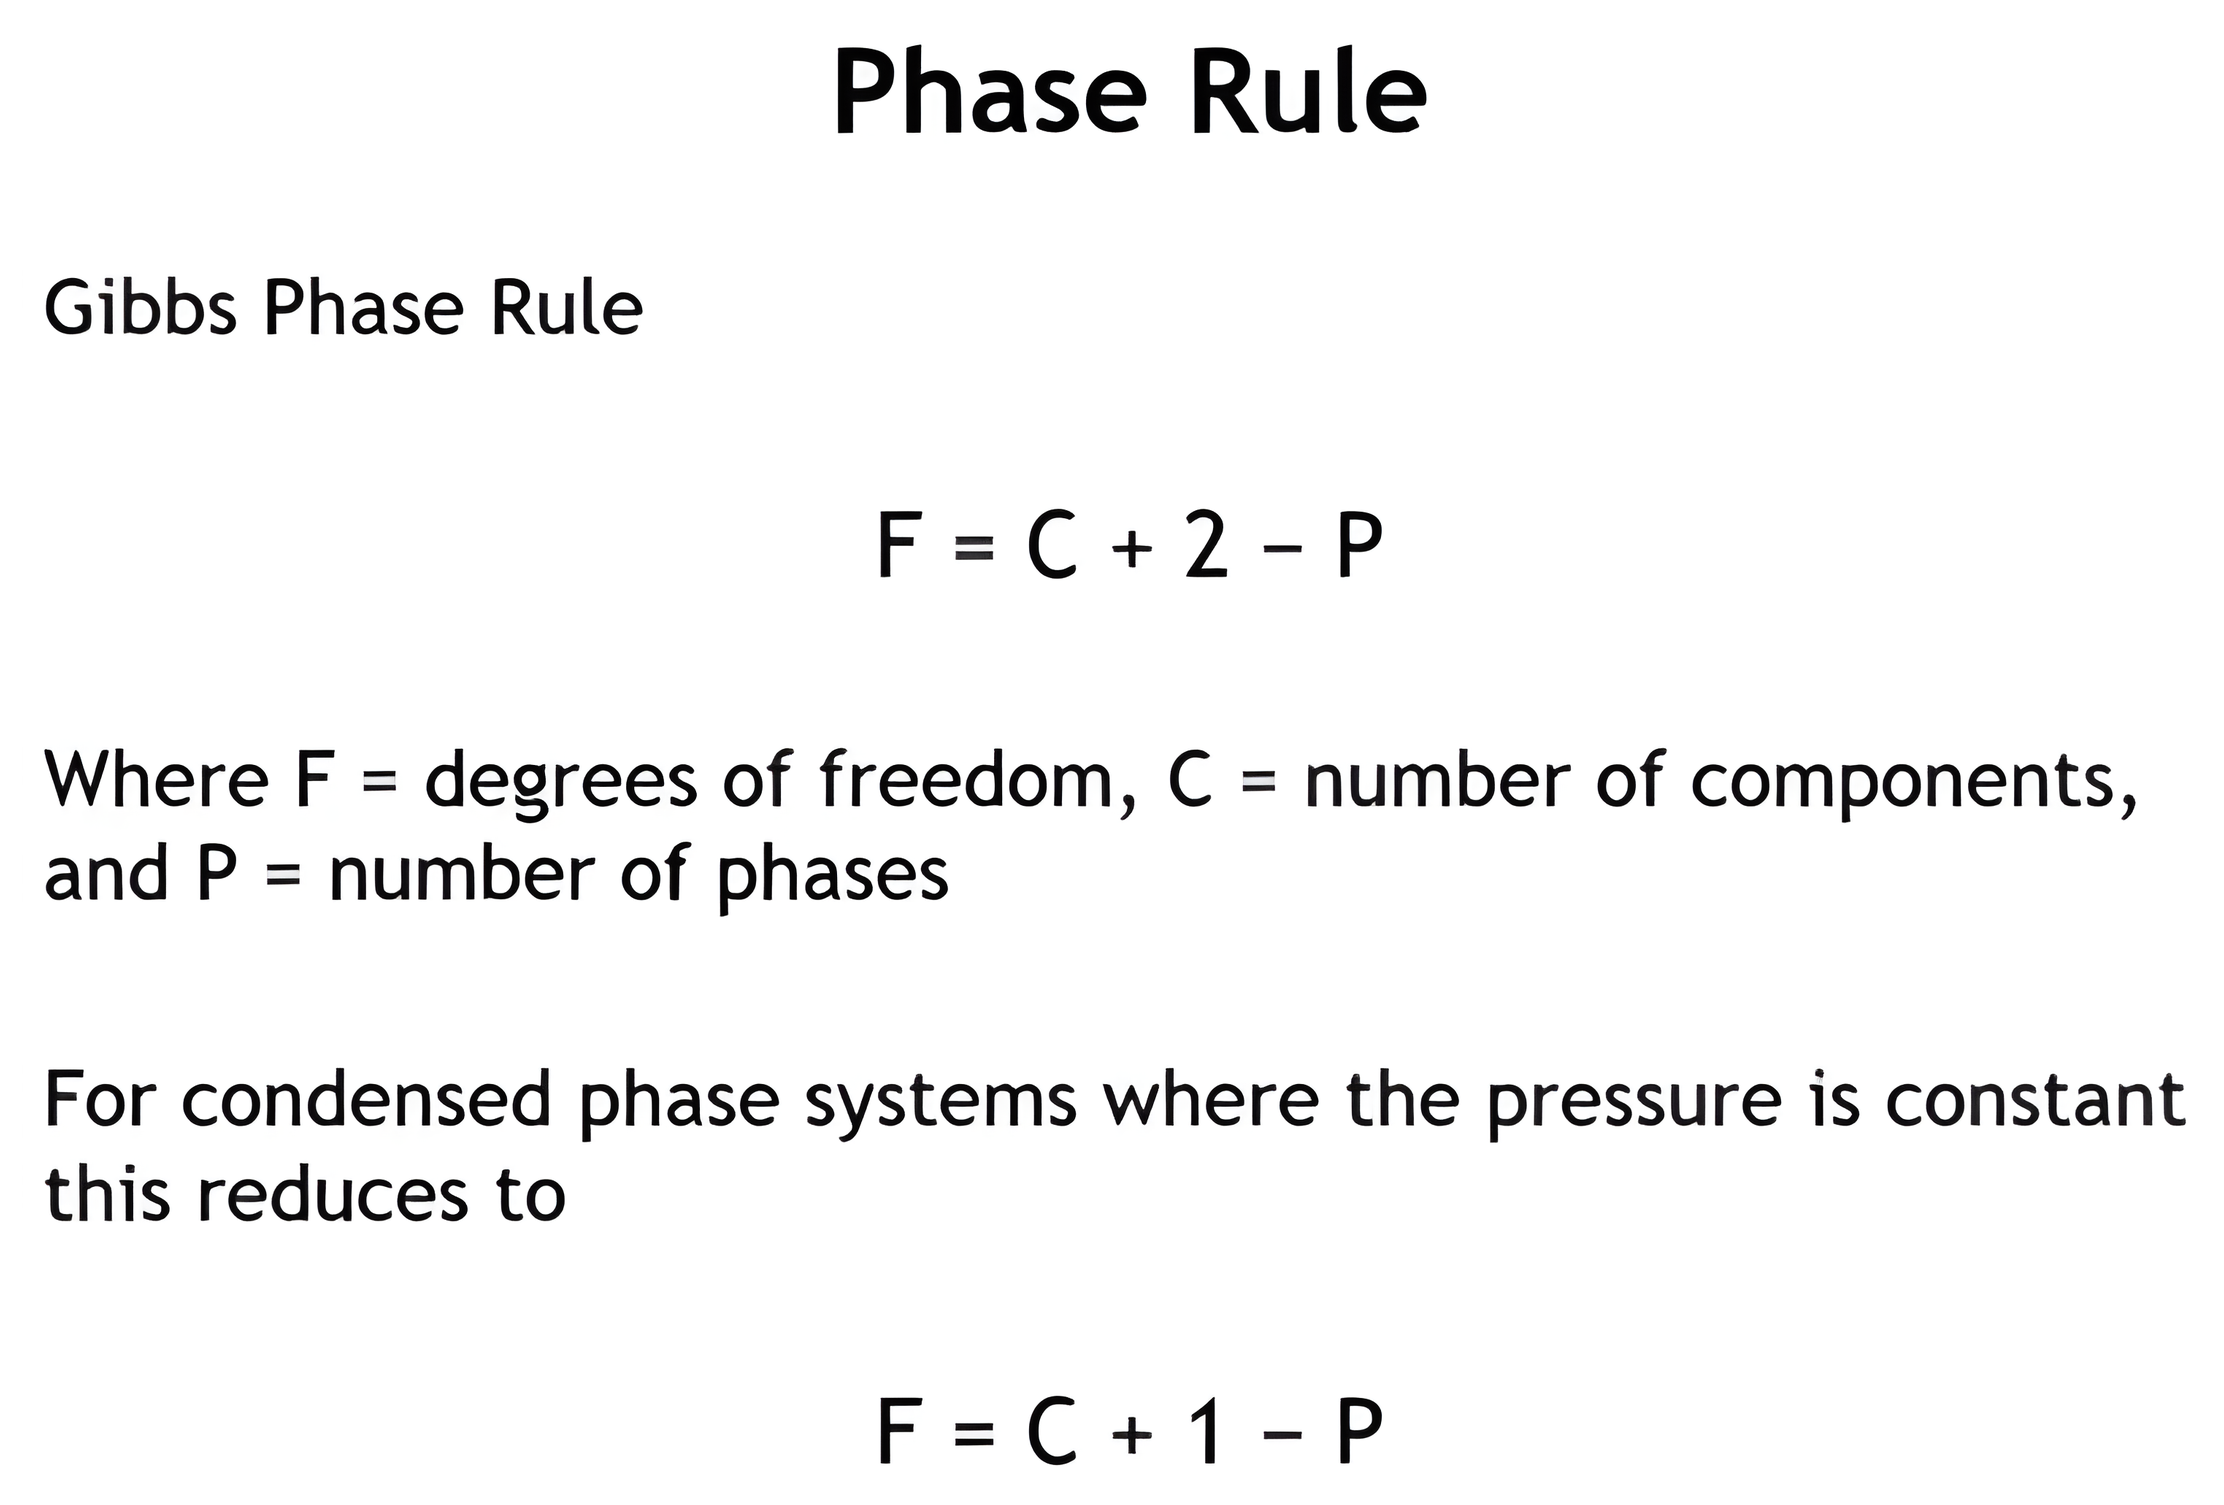
The Gibbs phase rule written as degrees of freedom equal components plus two minus phases, with its constant-pressure form, components plus one minus phases, below it.

One component: water

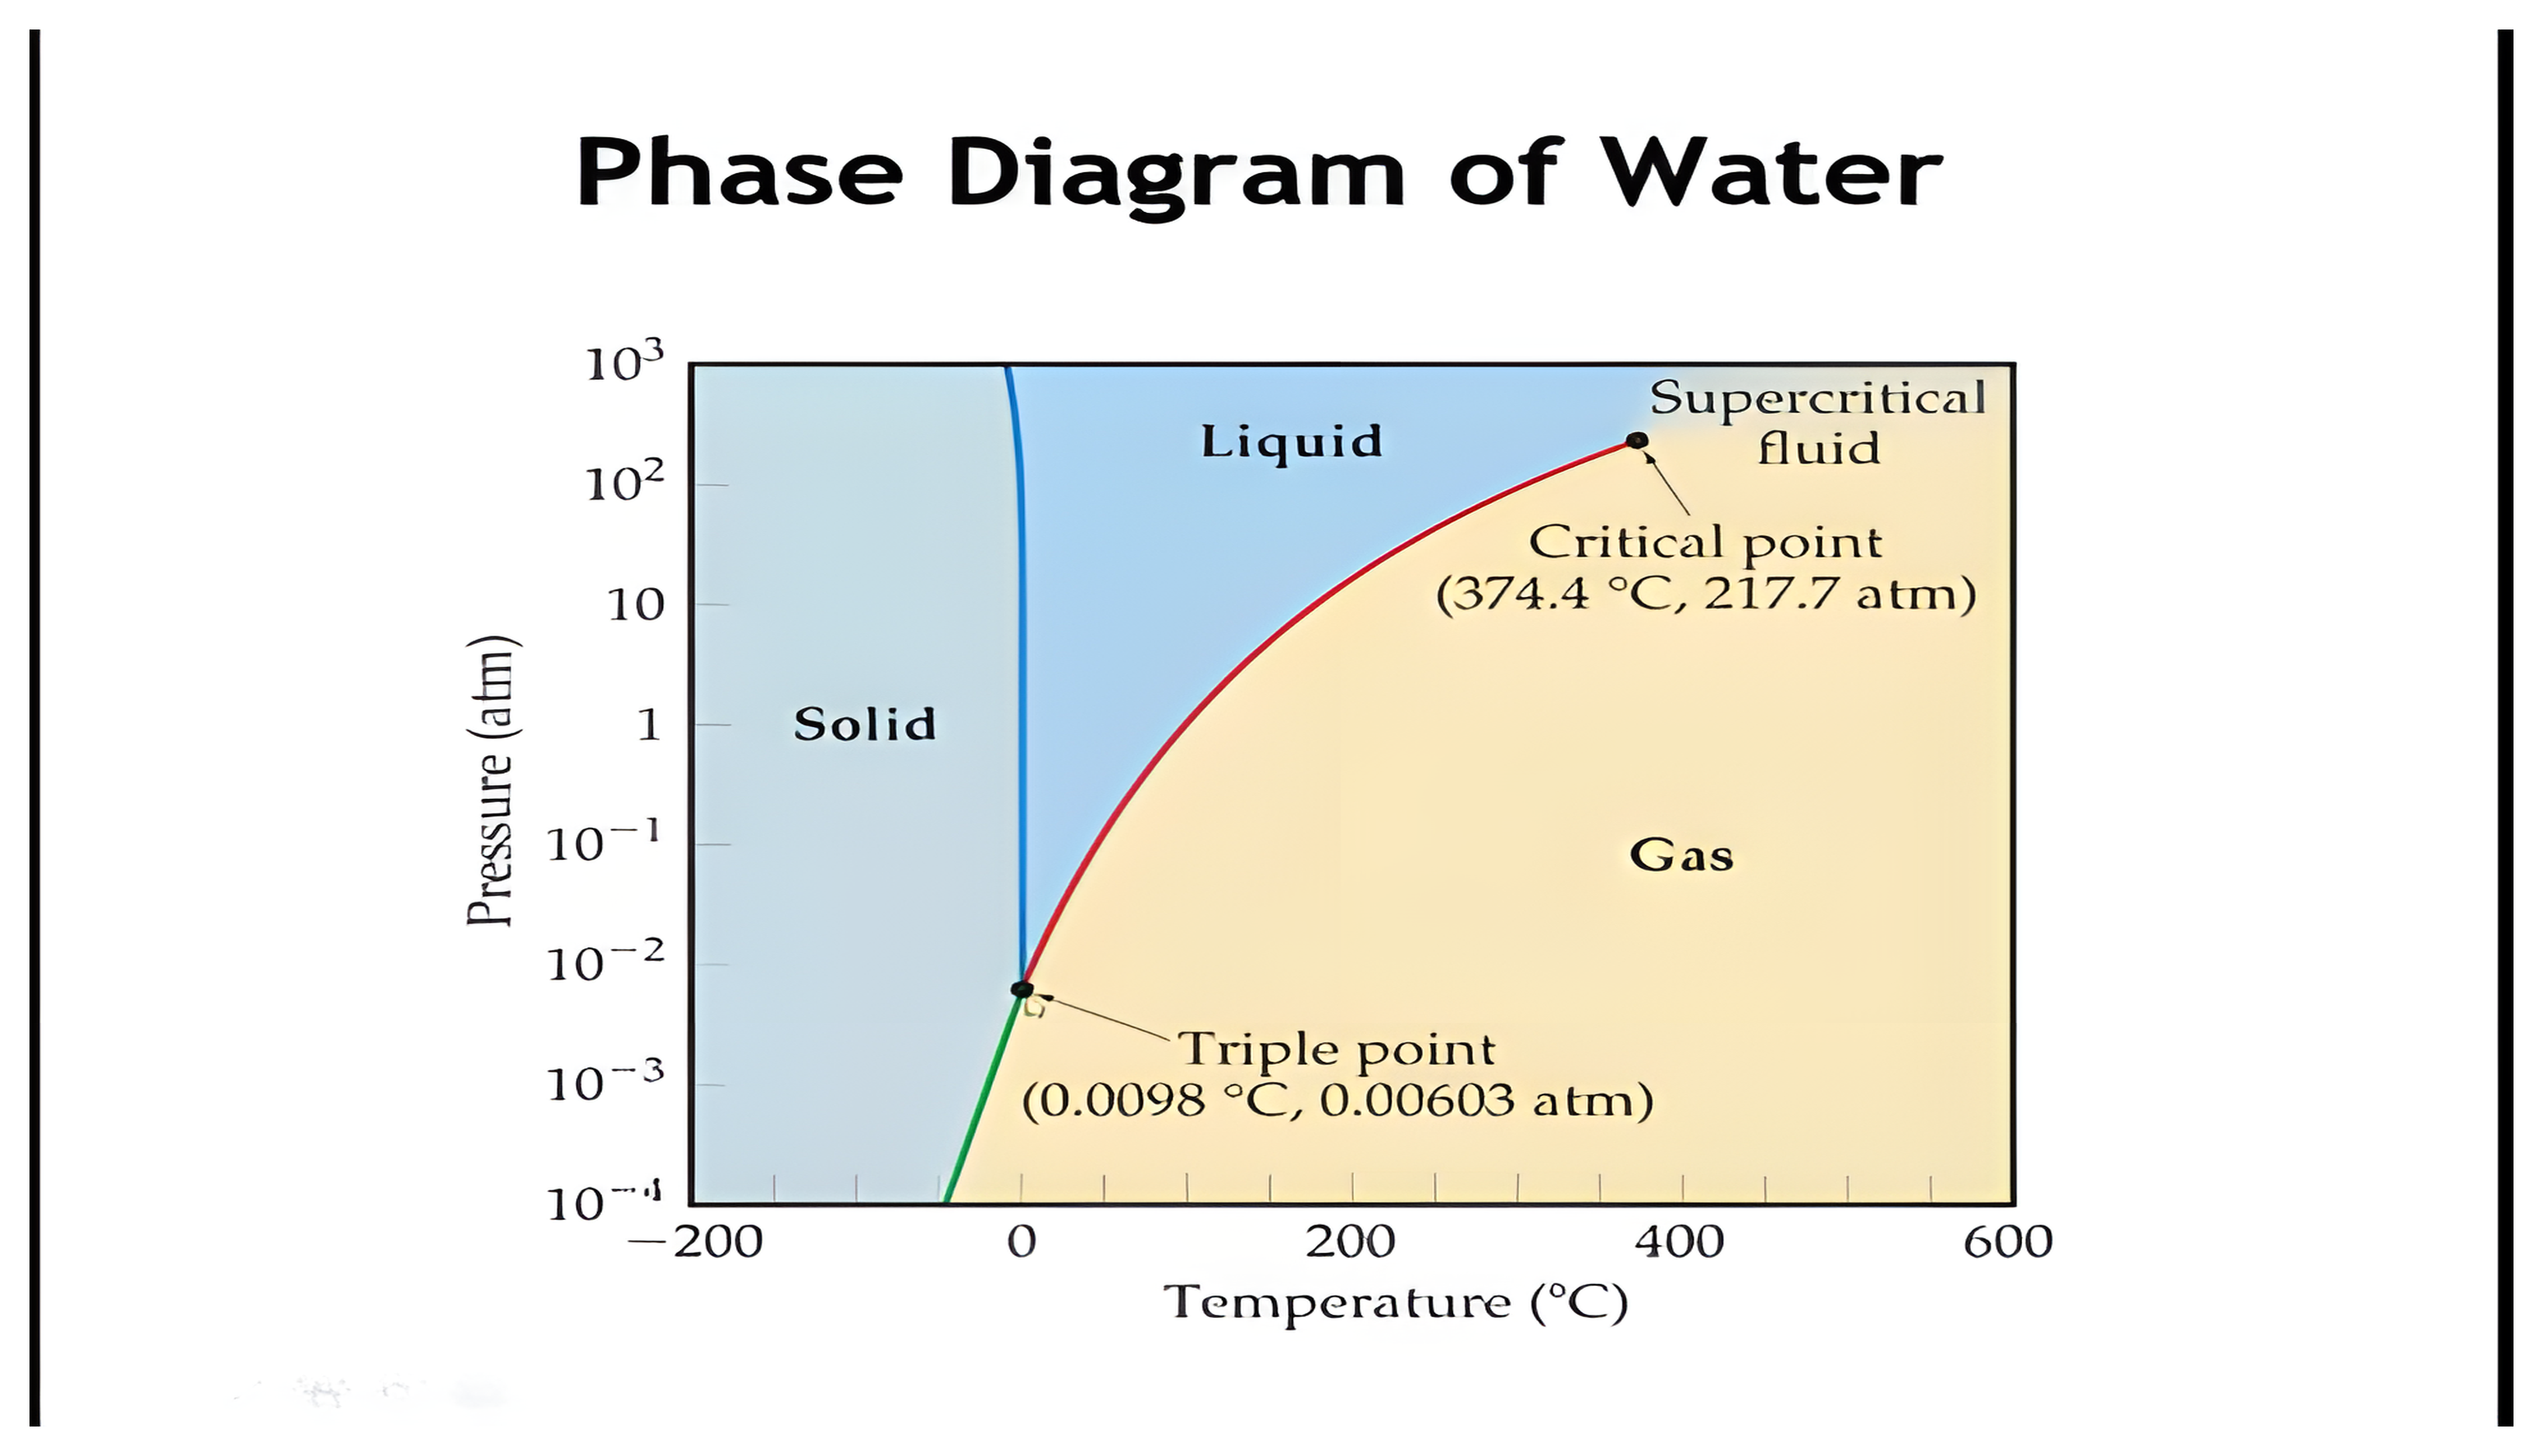
Pressure against temperature phase diagram of water, with the solid, liquid and gas fields, the triple point and the critical point marked.

A binary diagram: the axes

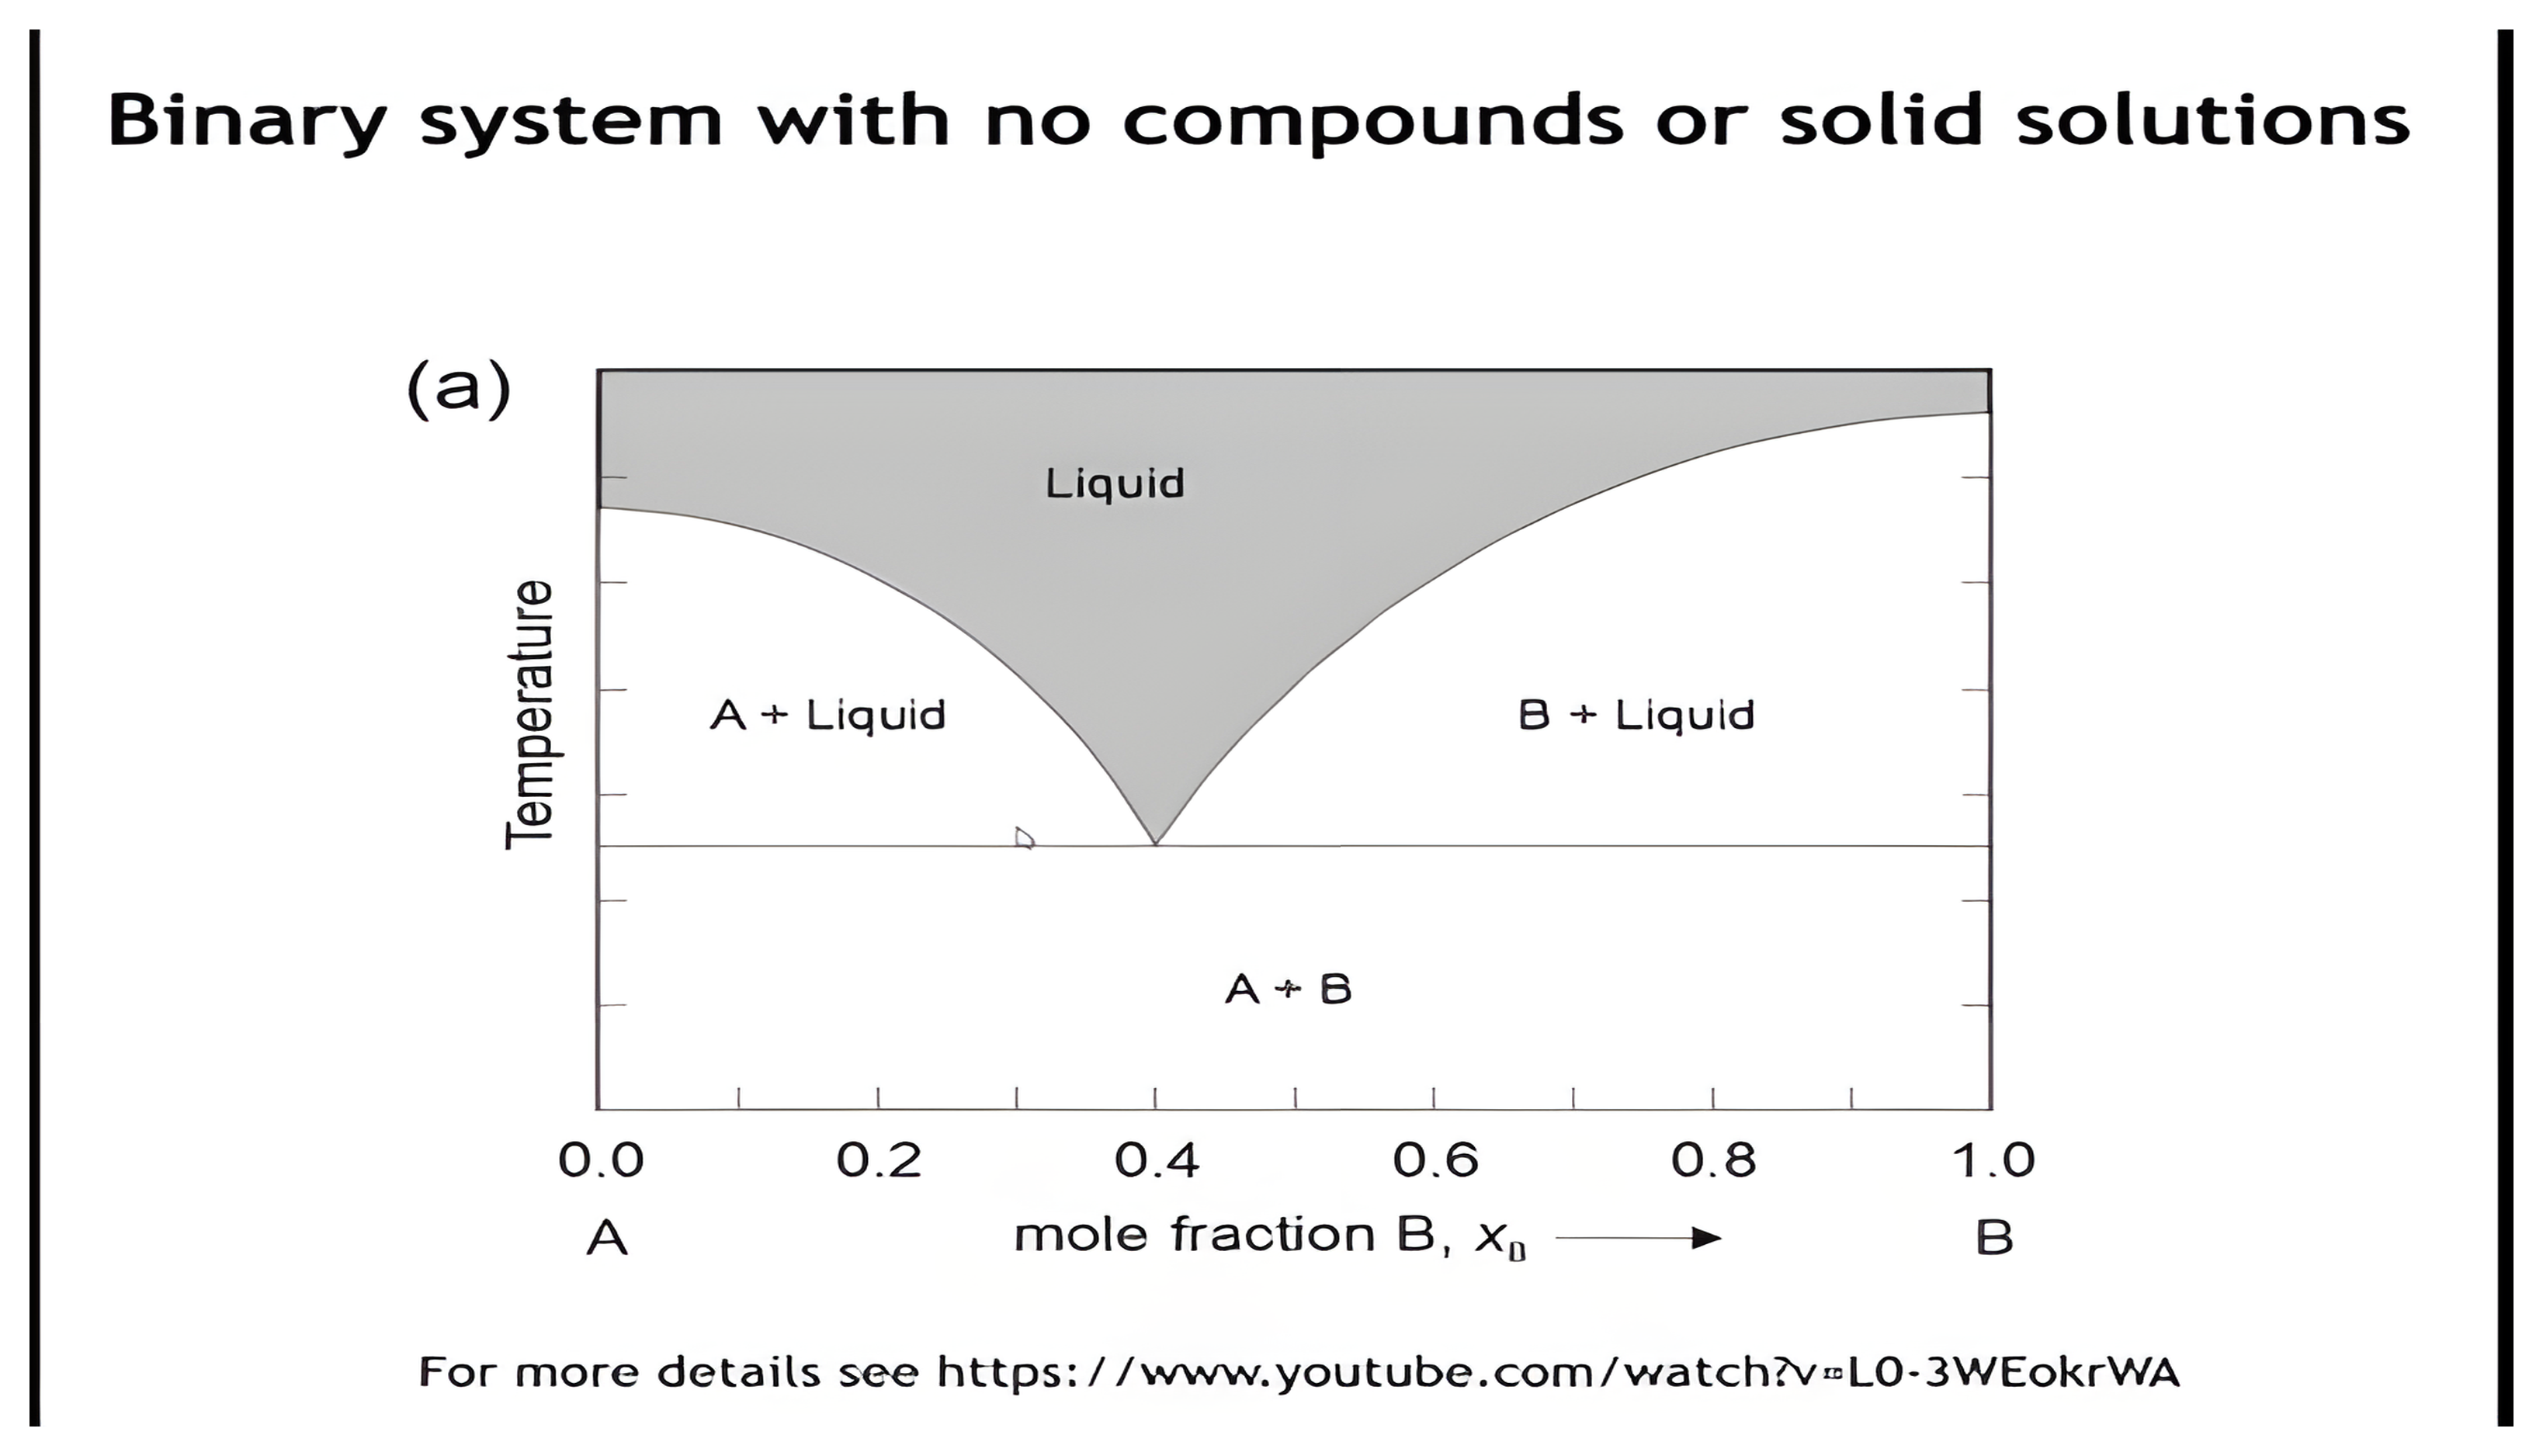
A binary temperature against mole-fraction diagram for a system with no compounds, unlabelled except for the liquid, A plus liquid, B plus liquid and A plus B fields.

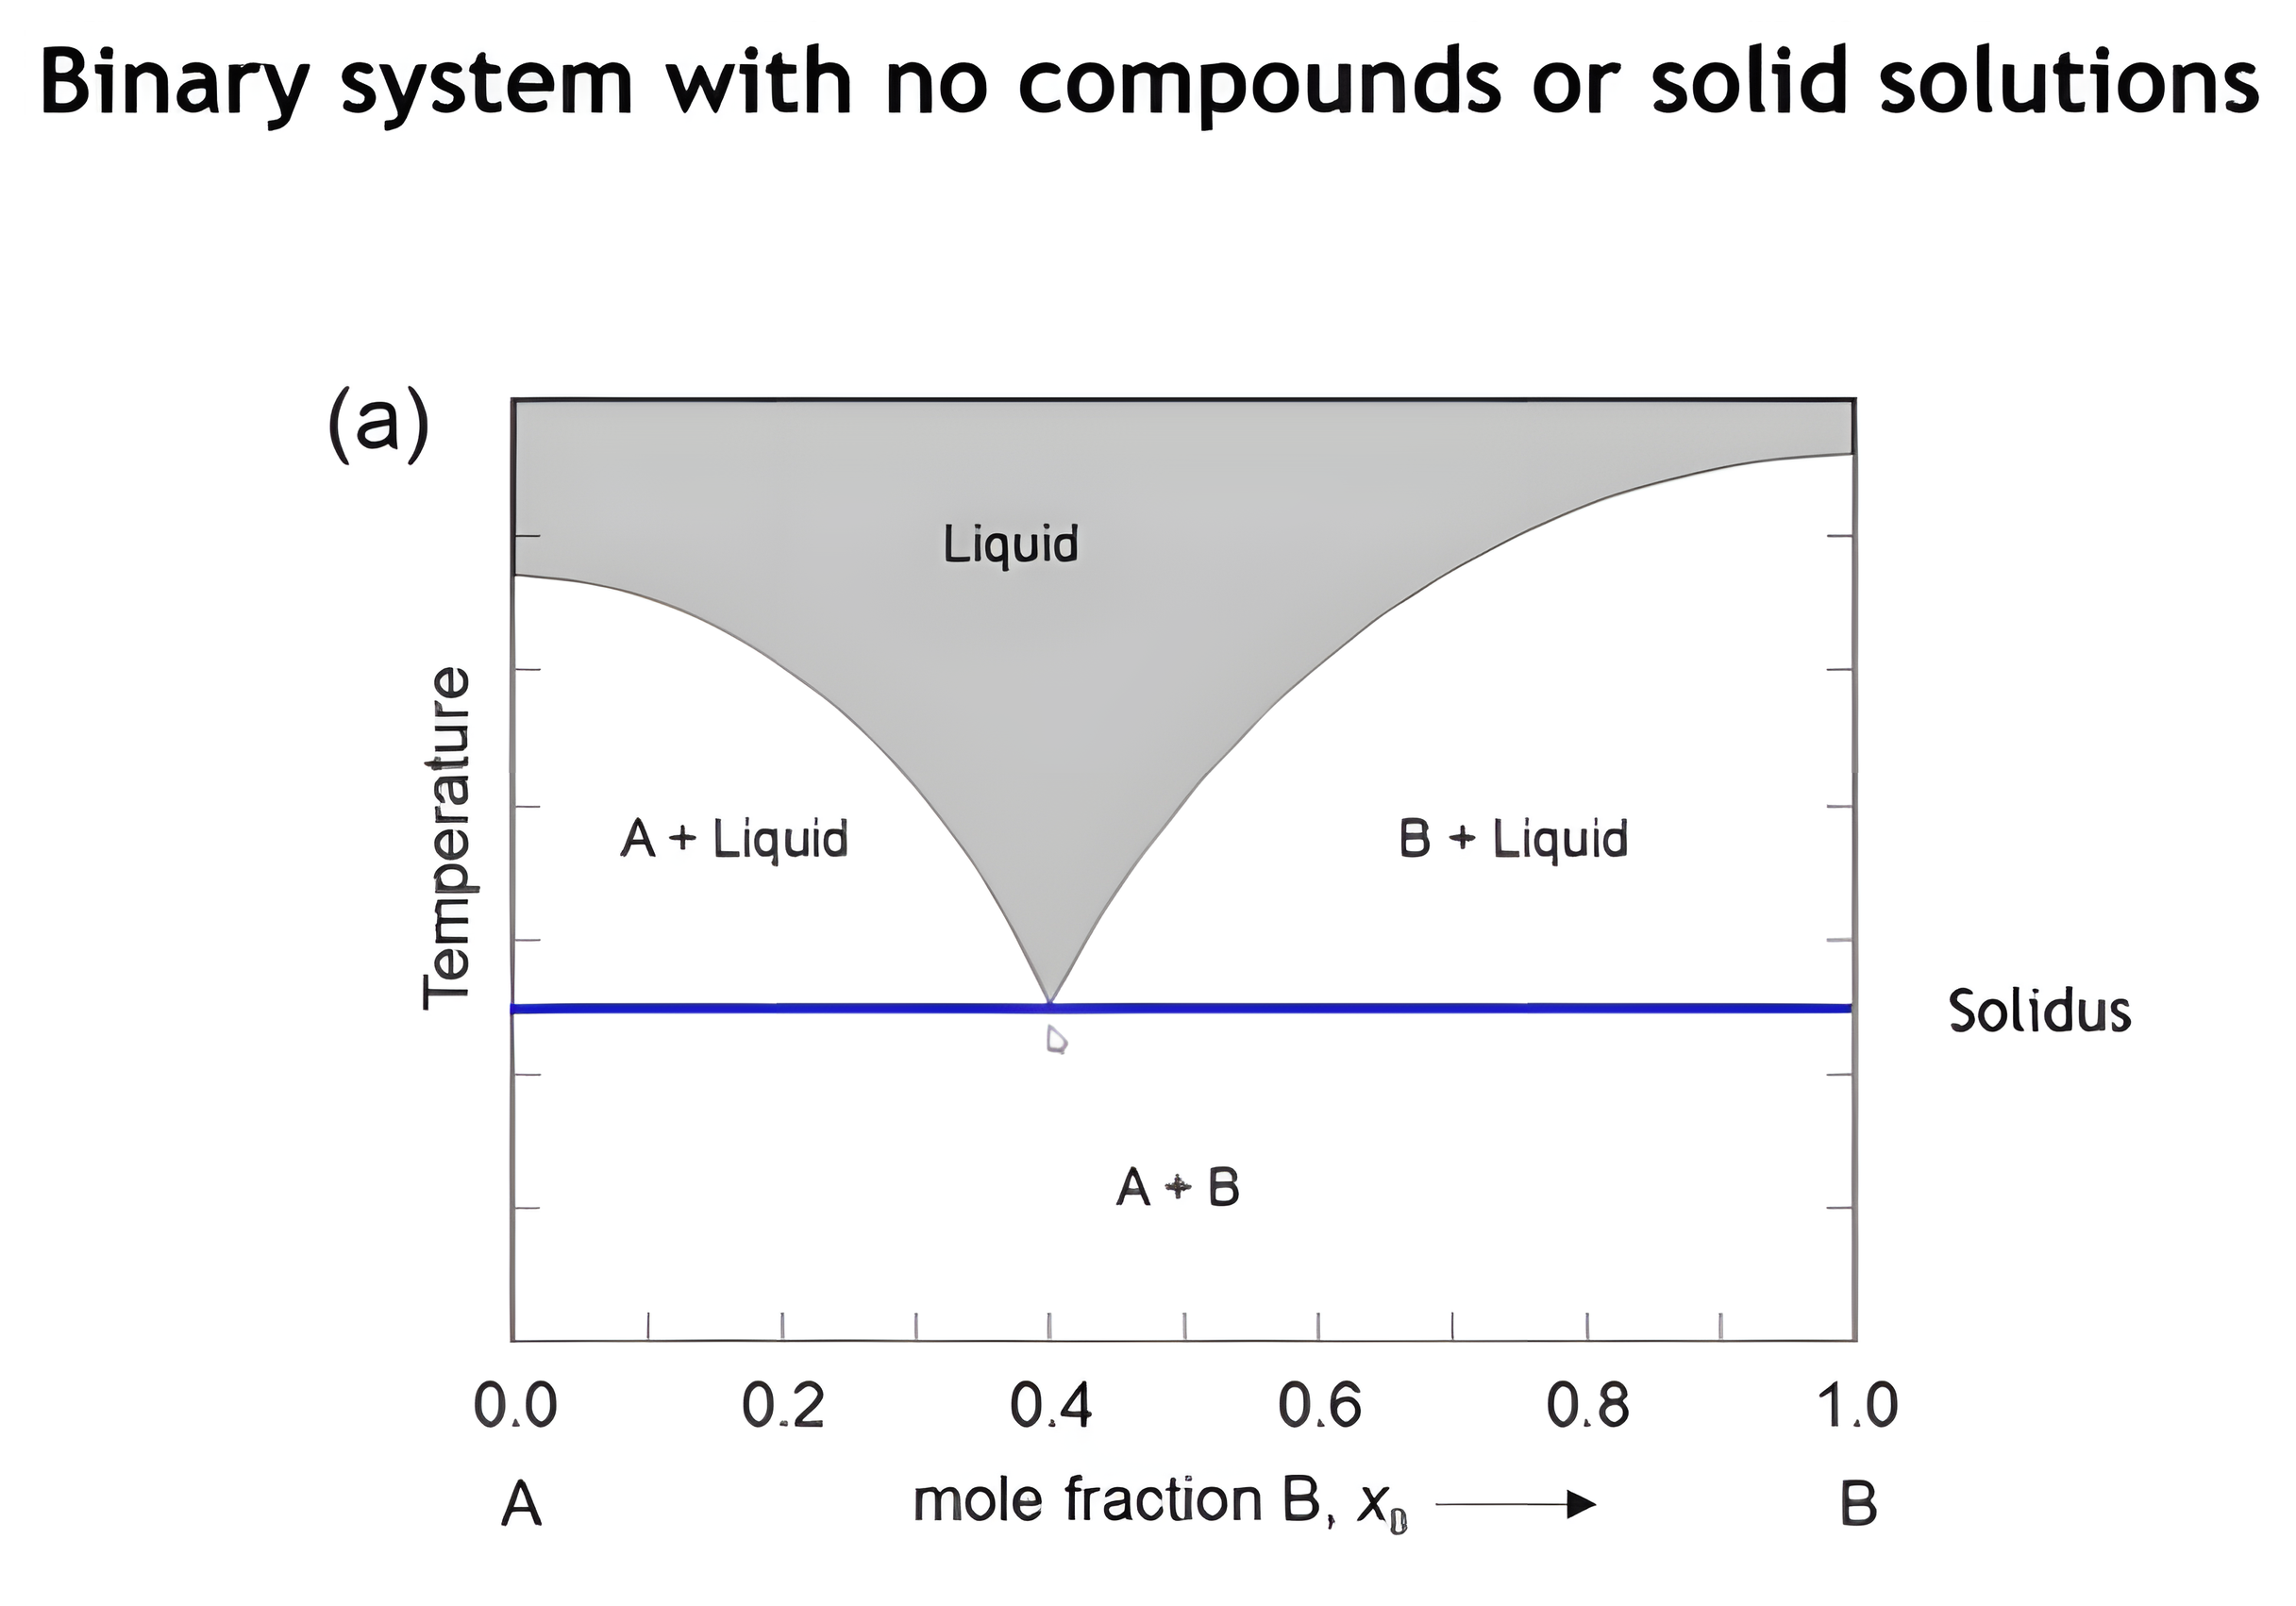
Binary system with no compounds

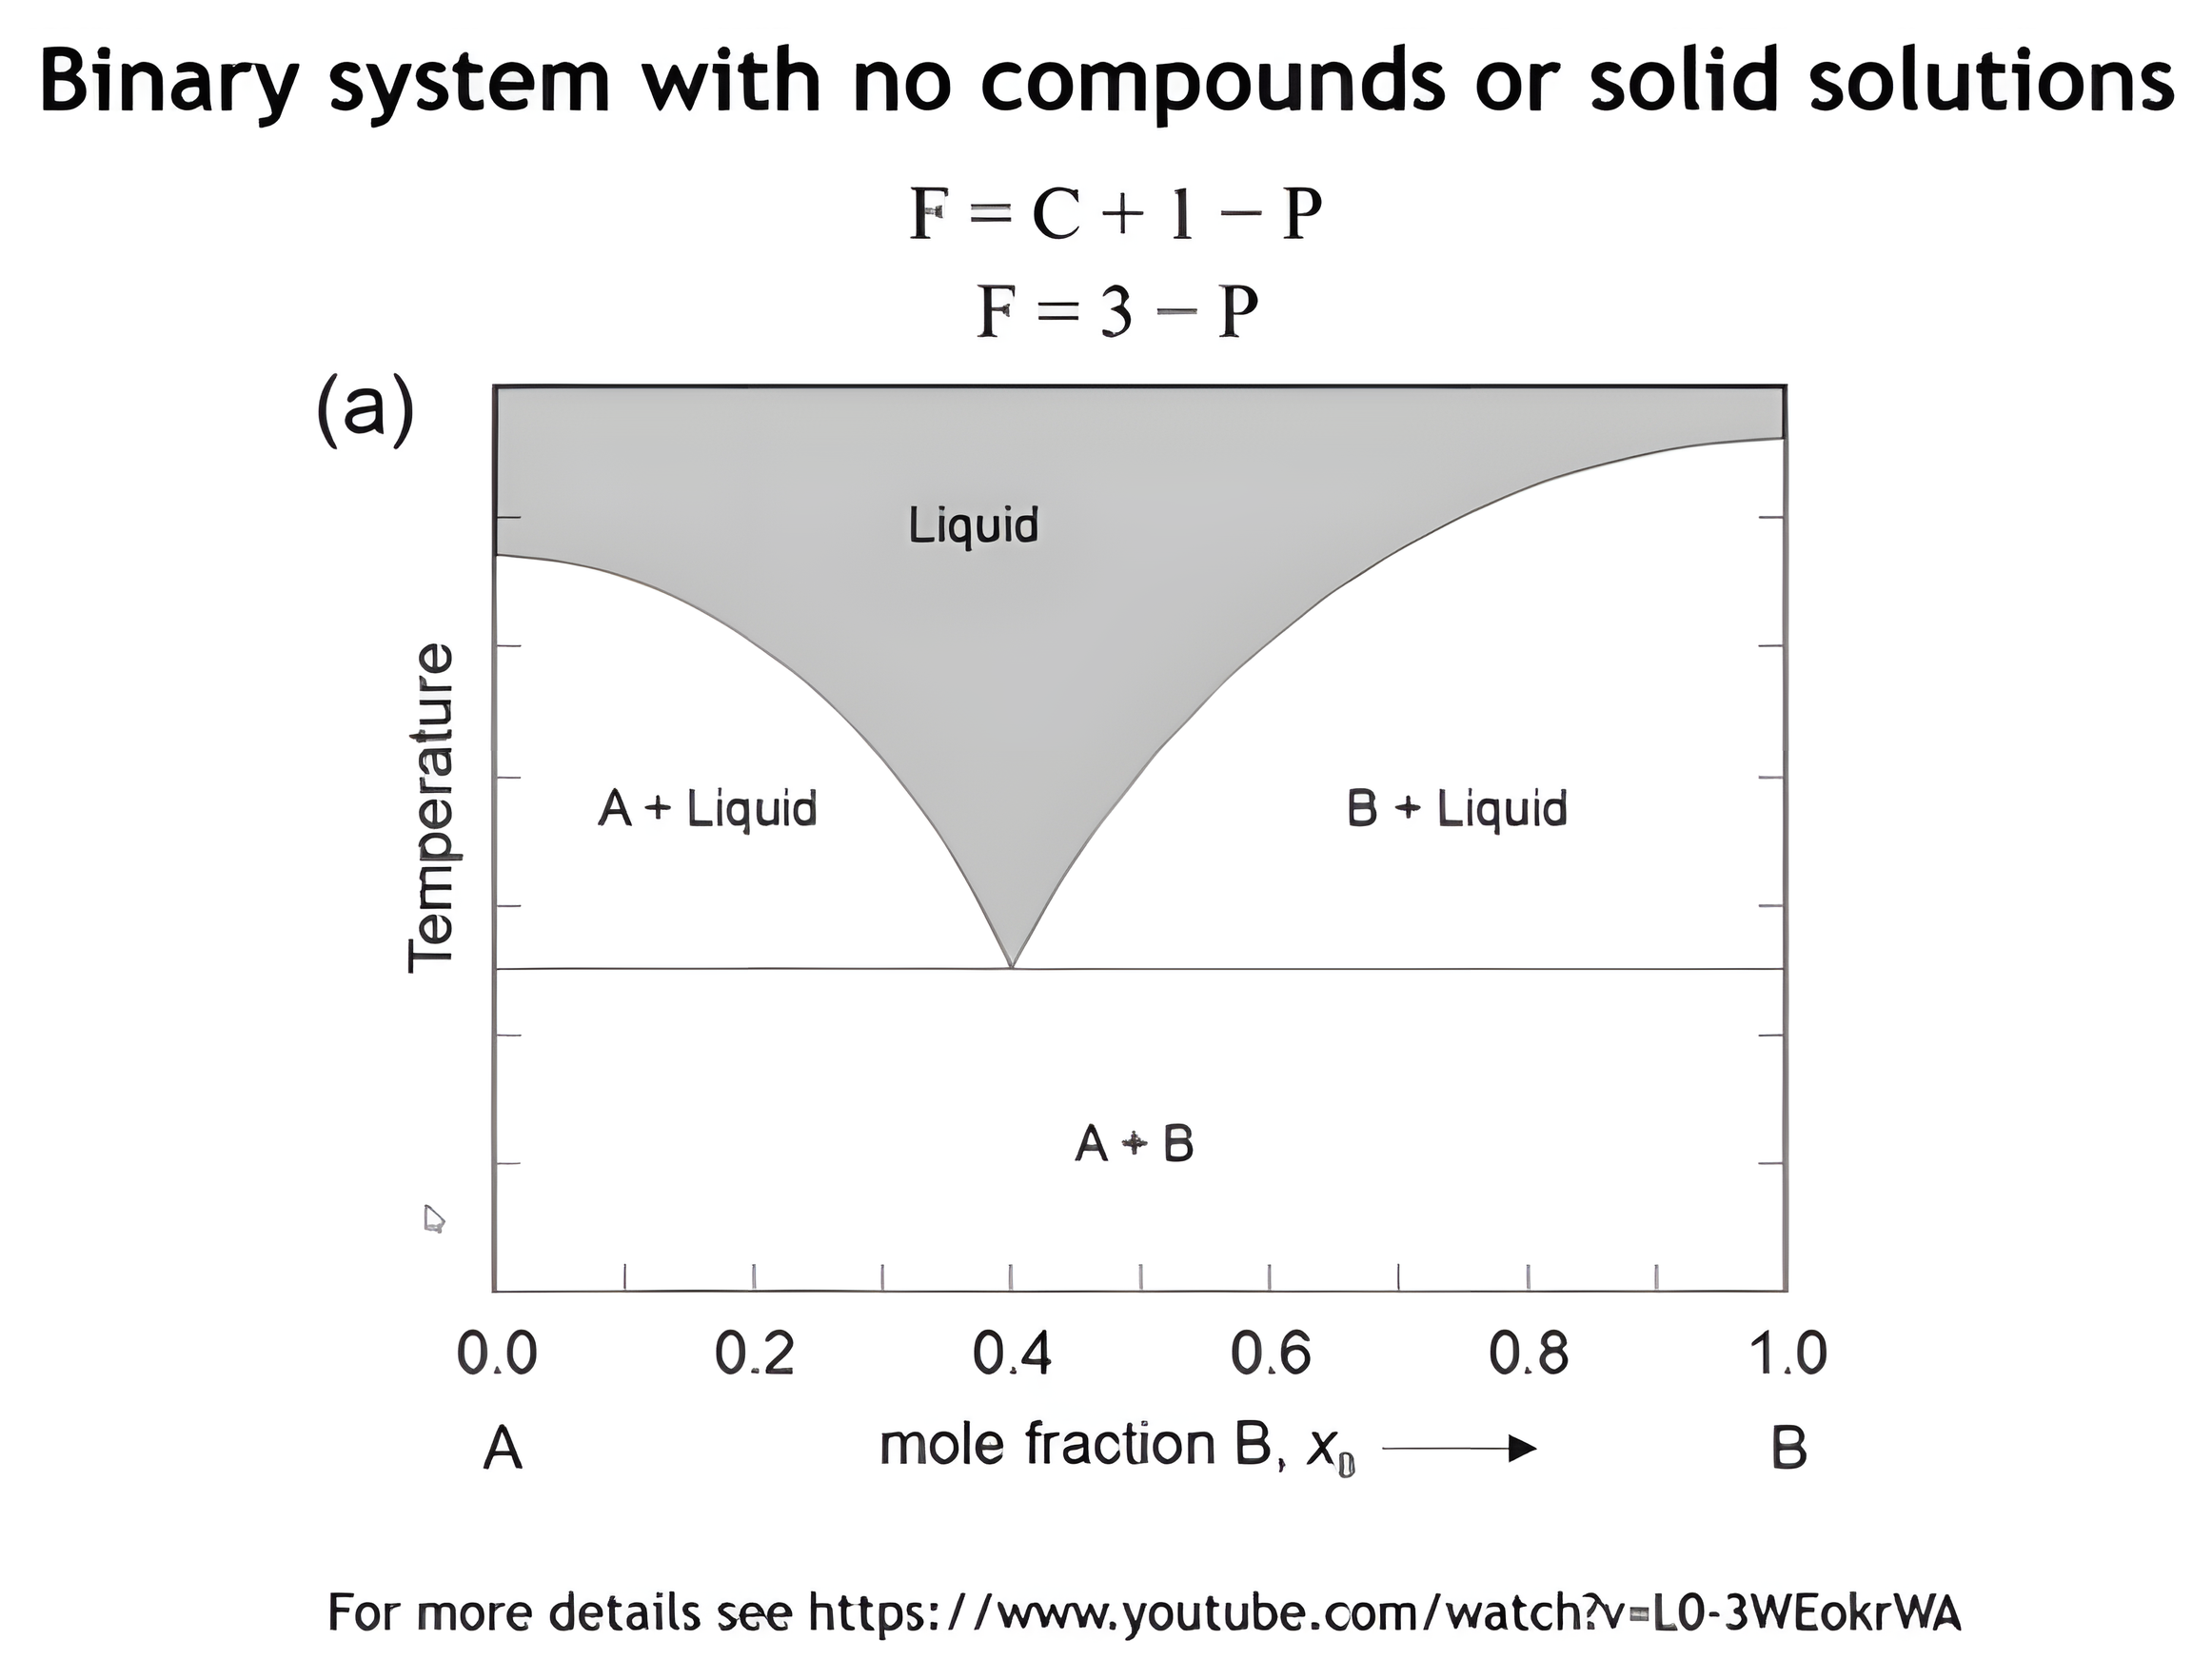
The binary eutectic diagram carrying the phase rule in its two-component form, F equals three minus P; advancing labels each field with the number of phases it holds.

Phase counts in each field

Liquid, two-phase fields, eutectic point
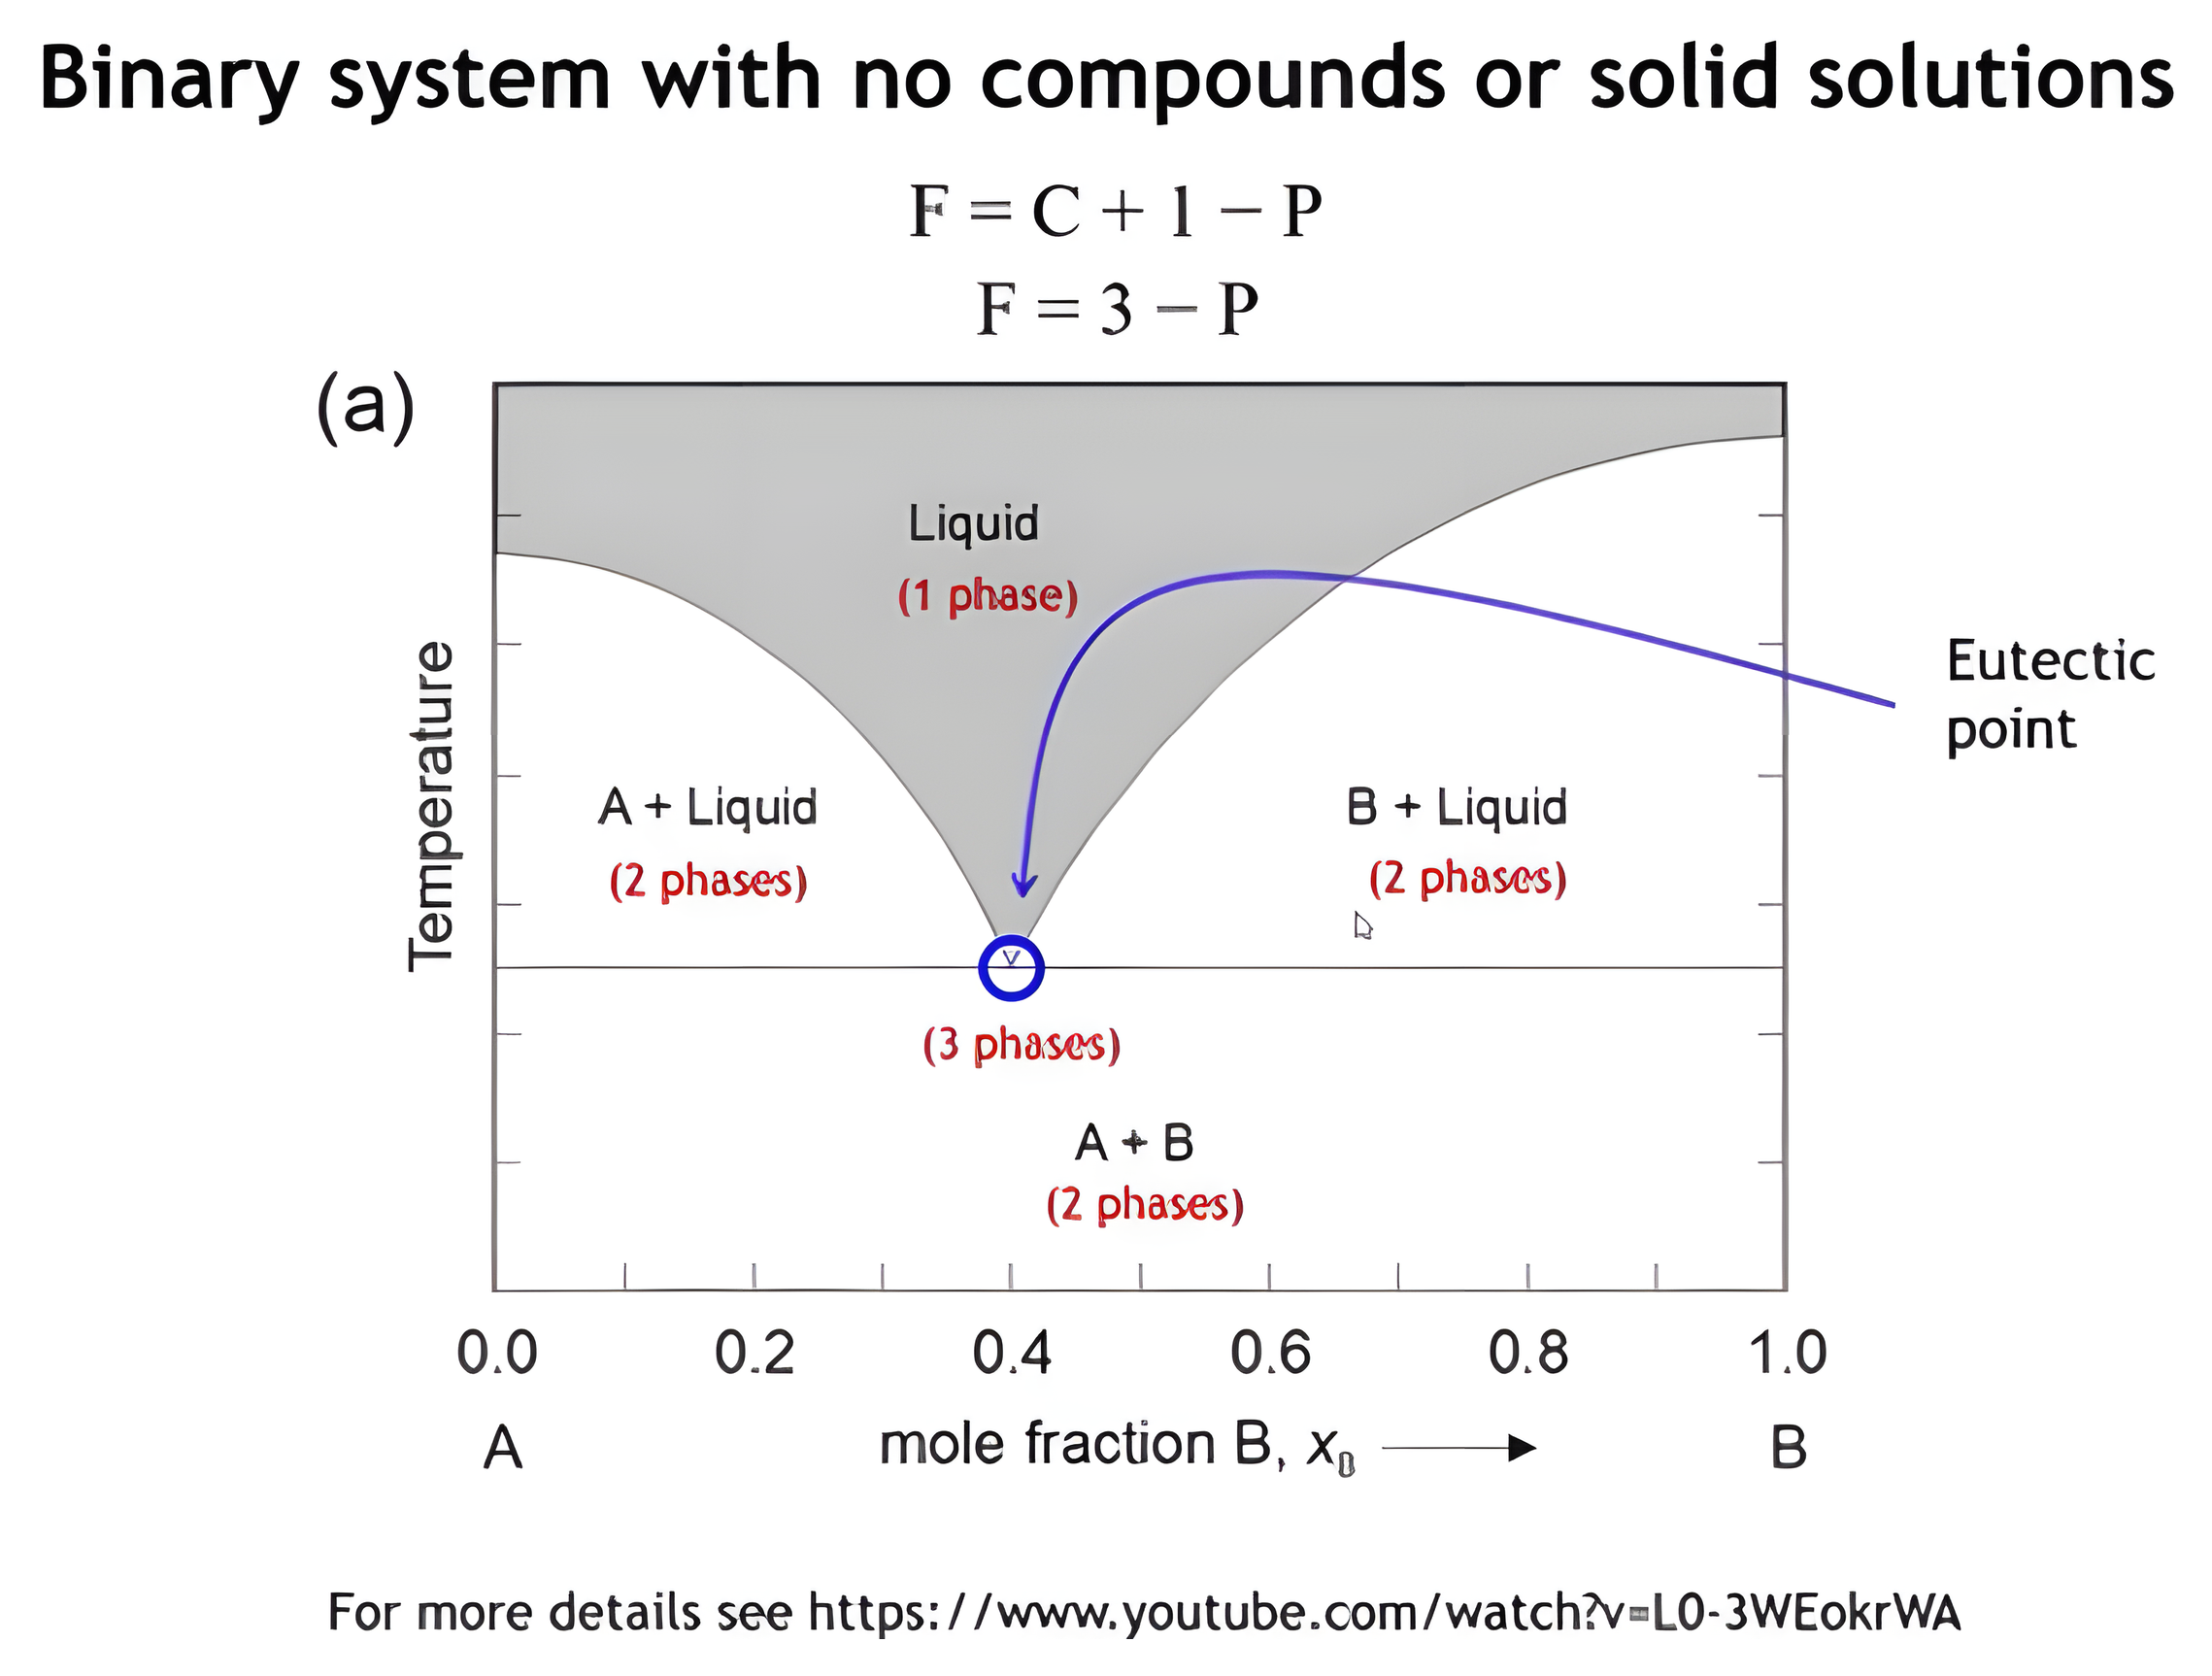
The binary eutectic diagram with the one-phase liquid field, the three two-phase fields and the three-phase eutectic point circled at the bottom of the liquid valley.

The solidus

The binary eutectic diagram with the horizontal solidus line drawn in blue across the diagram and labelled.

The liquidus, then cooling from point a
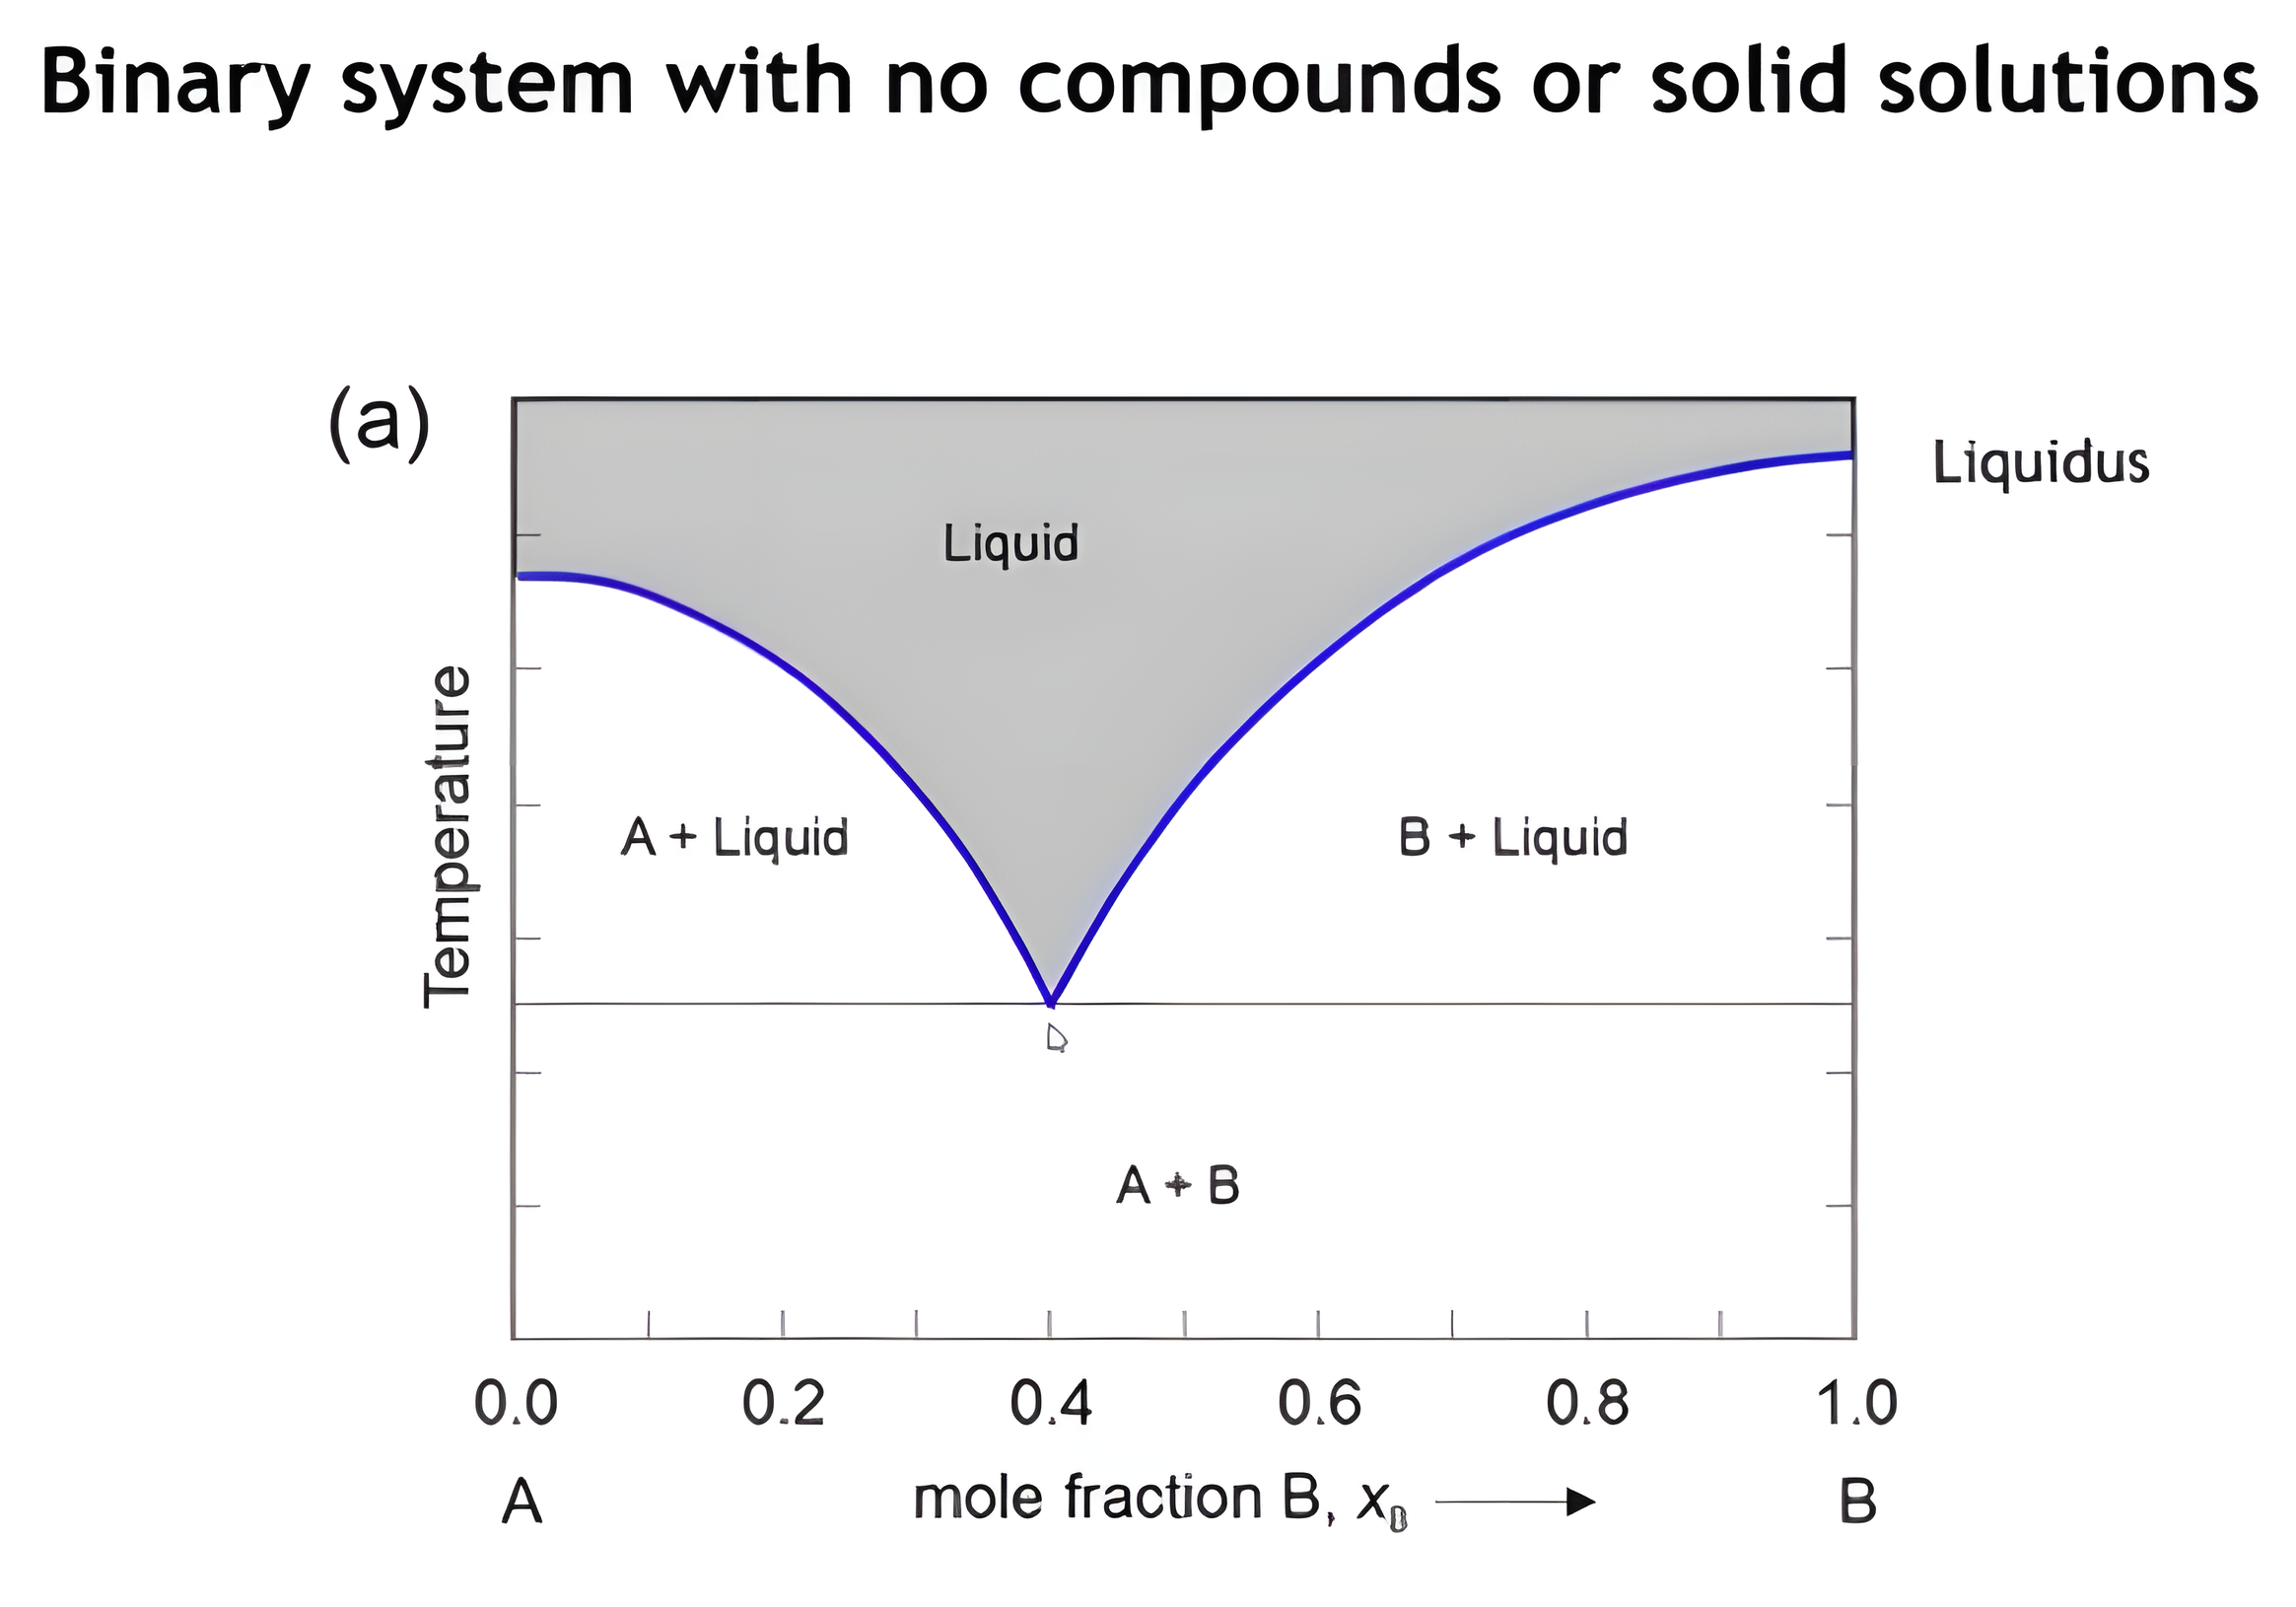
The binary eutectic diagram with the liquidus curve drawn and labelled; advancing marks point a in the liquid field and then cools it down to point b on the liquidus.

Point a: a homogeneous liquid

Cooling to point b on the liquidus

Tie line at point c, then the lever rule
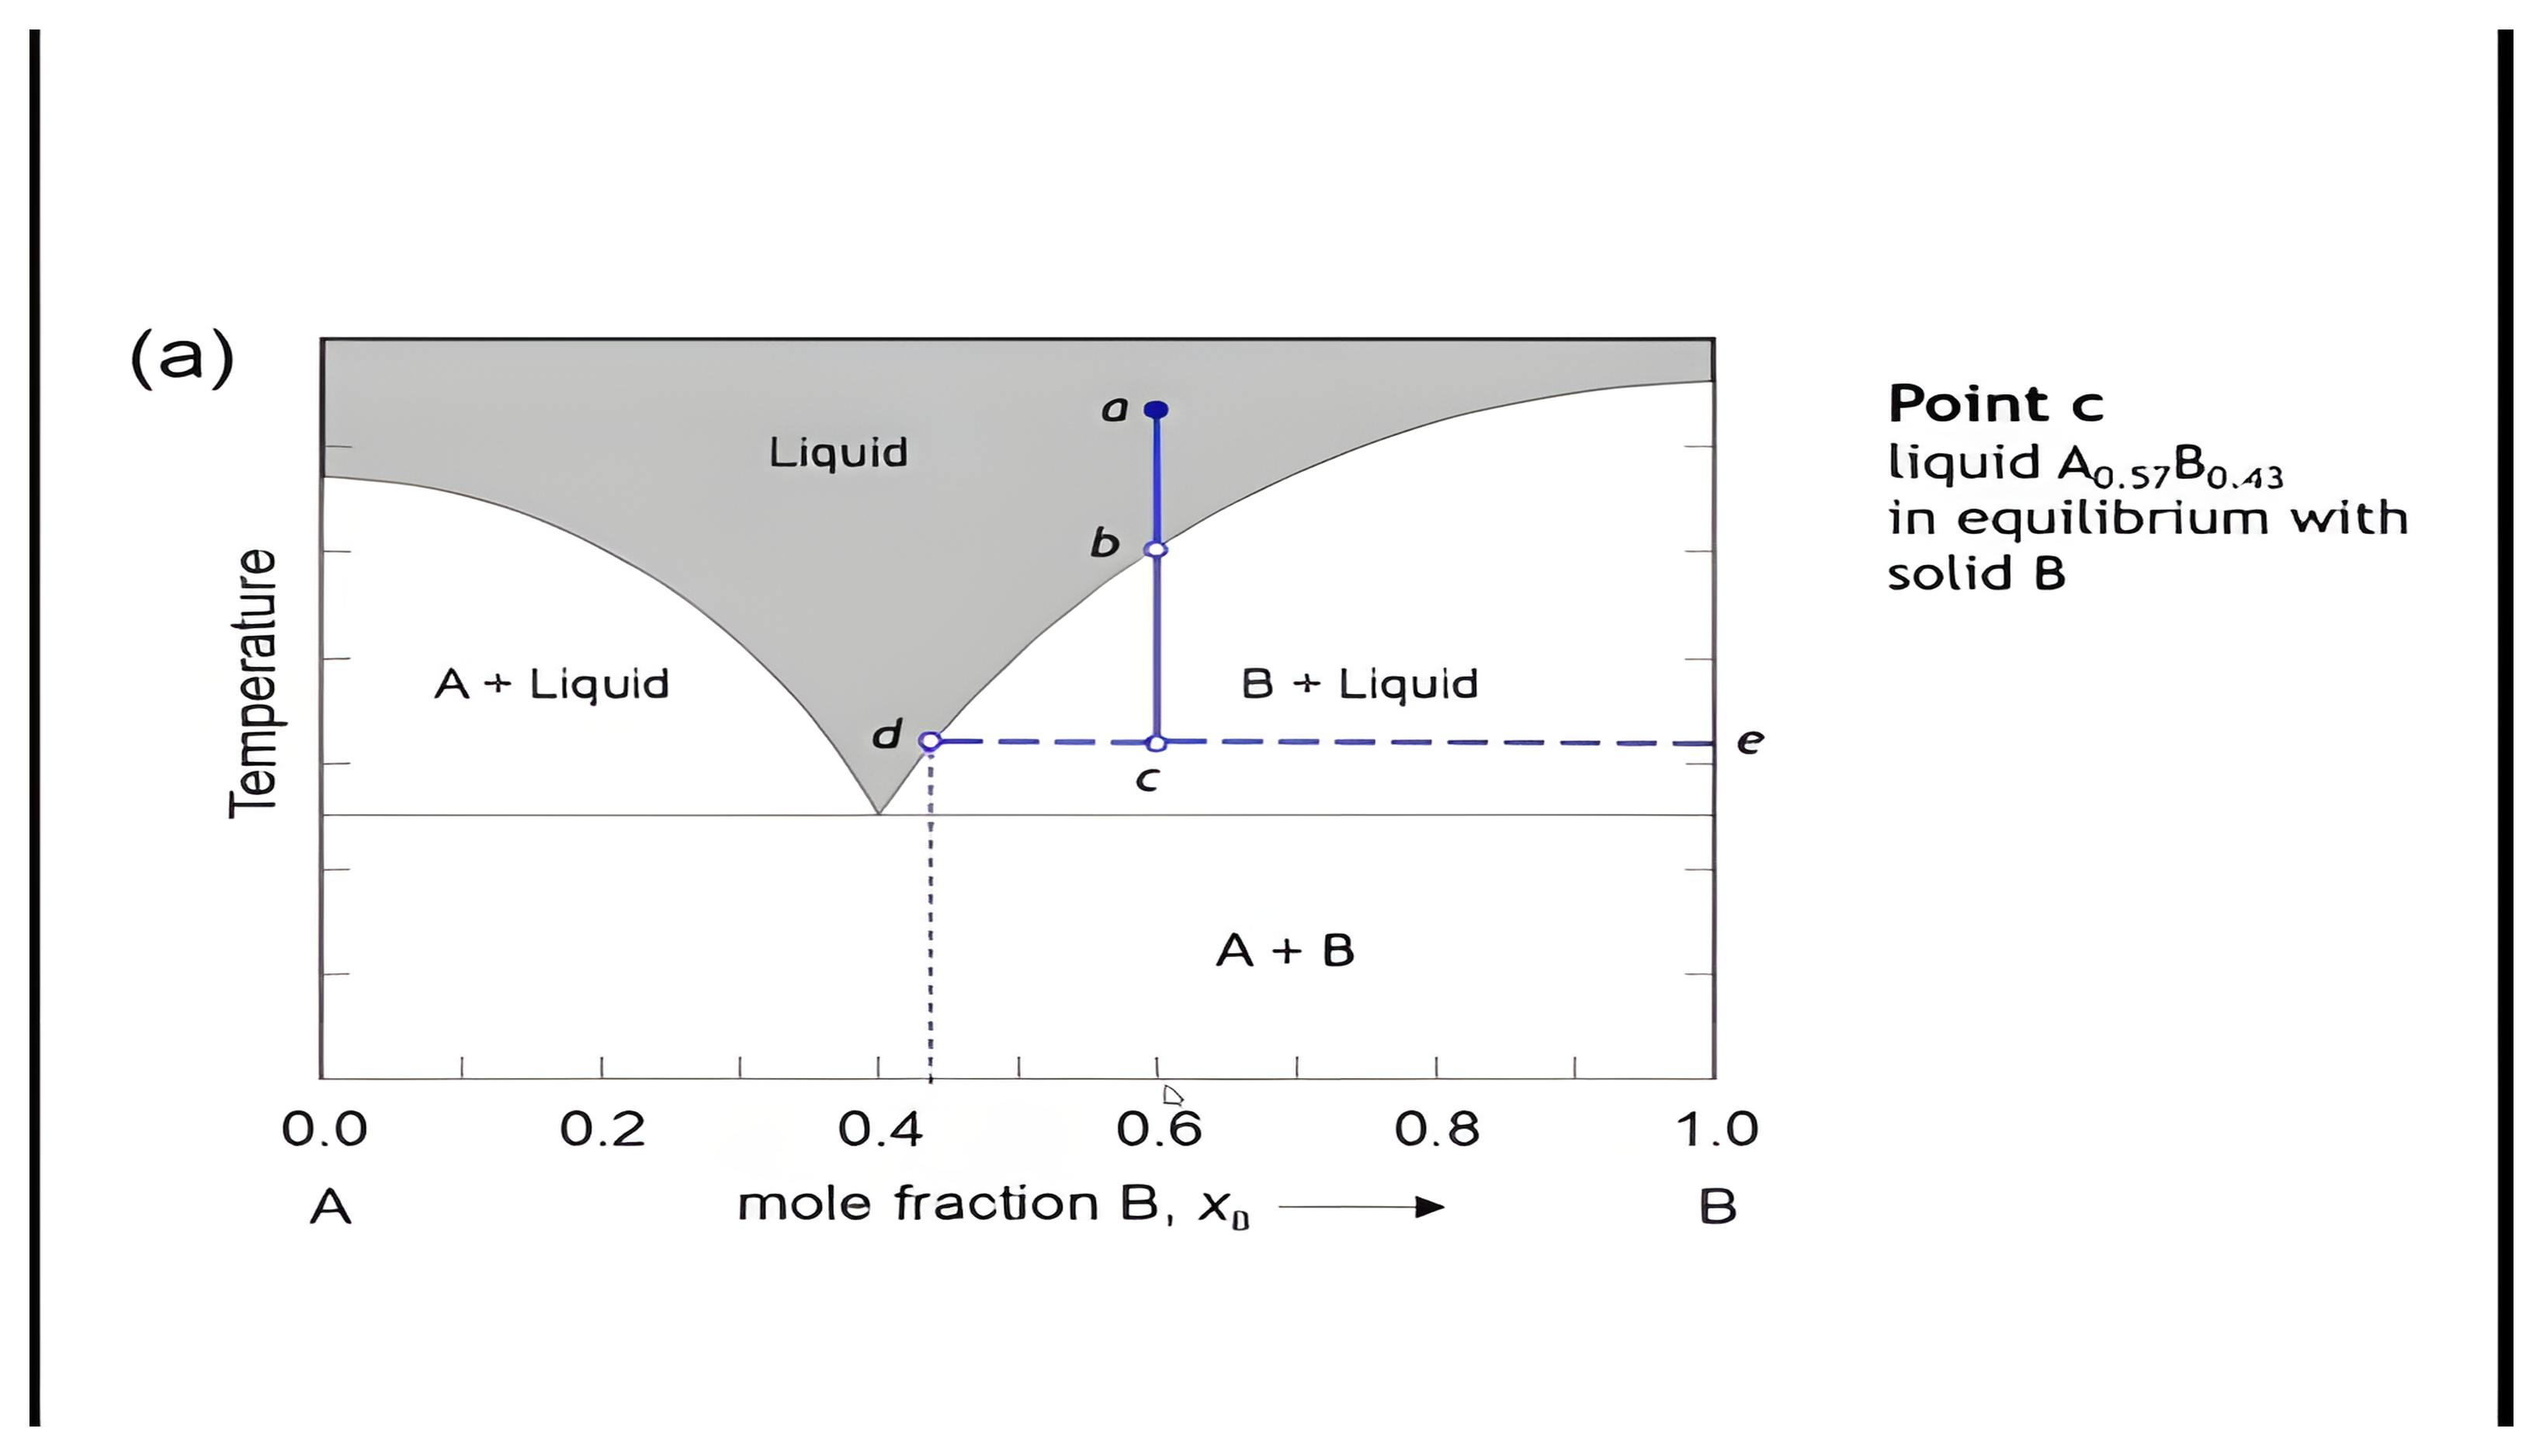
The binary eutectic diagram with a horizontal tie line drawn through point c from the liquidus at d to pure B at e; advancing adds the lever-rule ratio and then the worked numbers.

The lever-rule ratio

Working the numbers

A real eutectic: diopside and anorthite
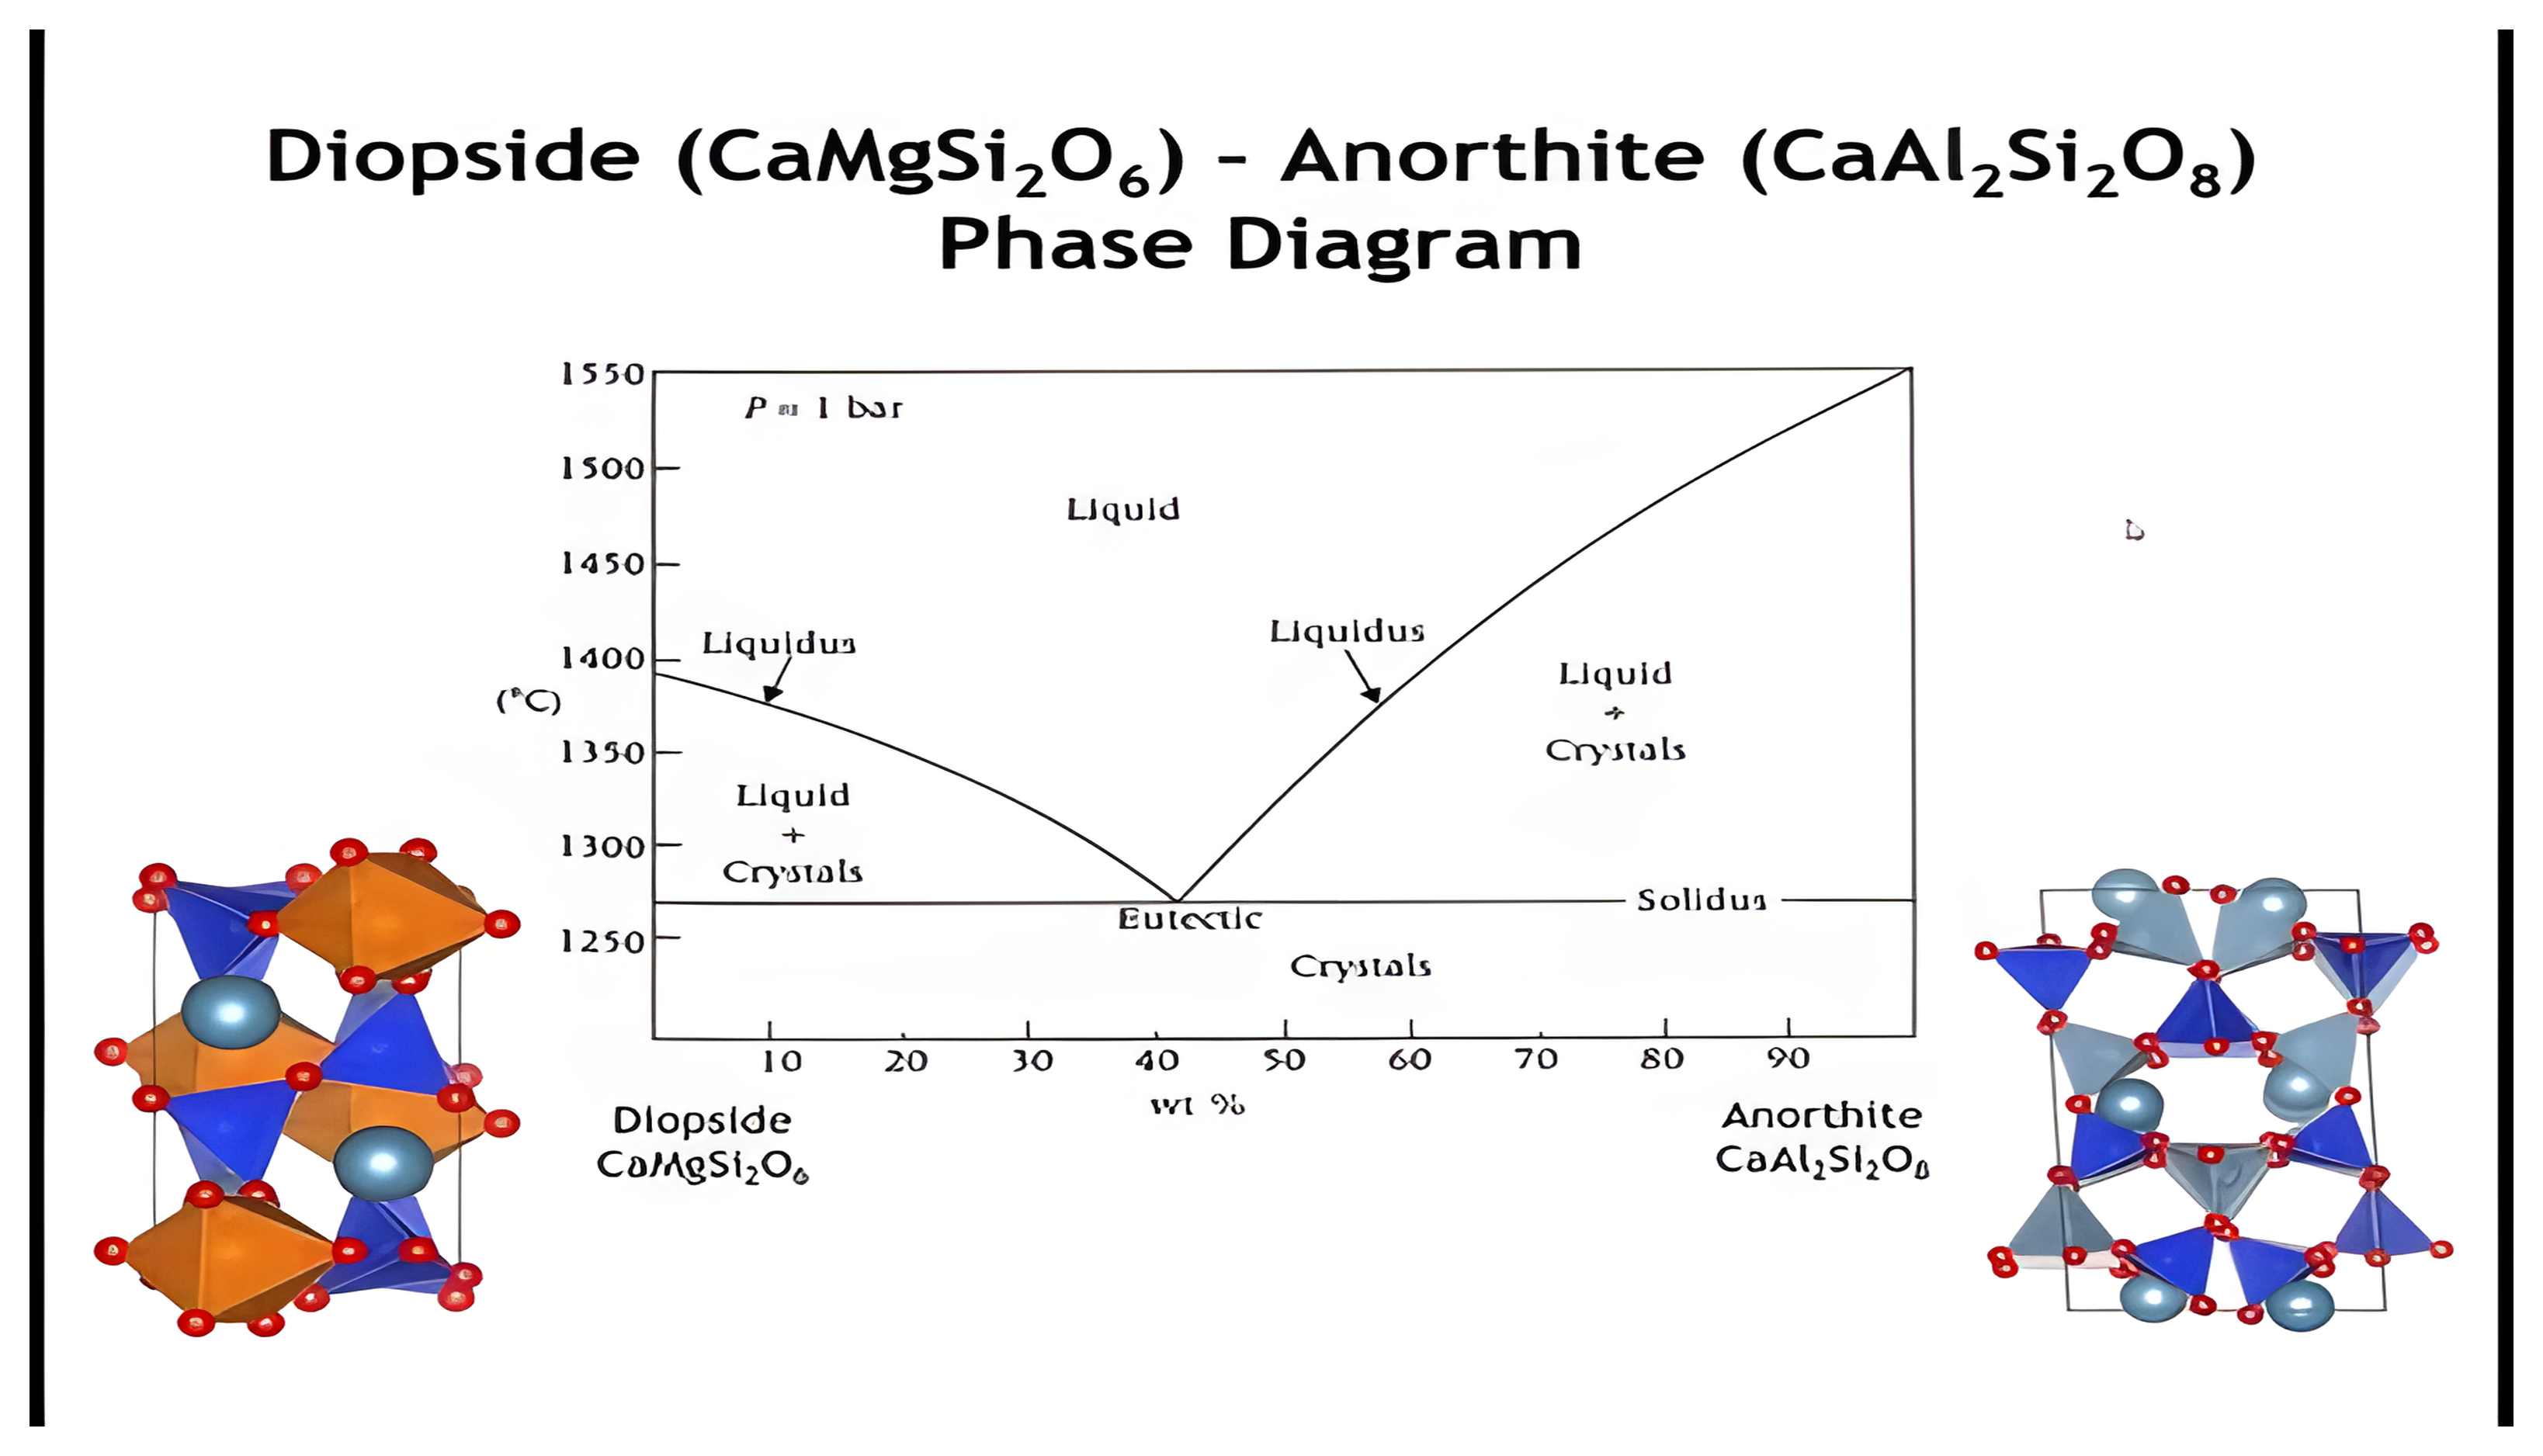
The diopside and anorthite temperature against weight-percent phase diagram at one bar, with its liquidus branches, eutectic and solidus, beside polyhedral structure drawings of the two minerals.

Melting a solid solution: silver and gold
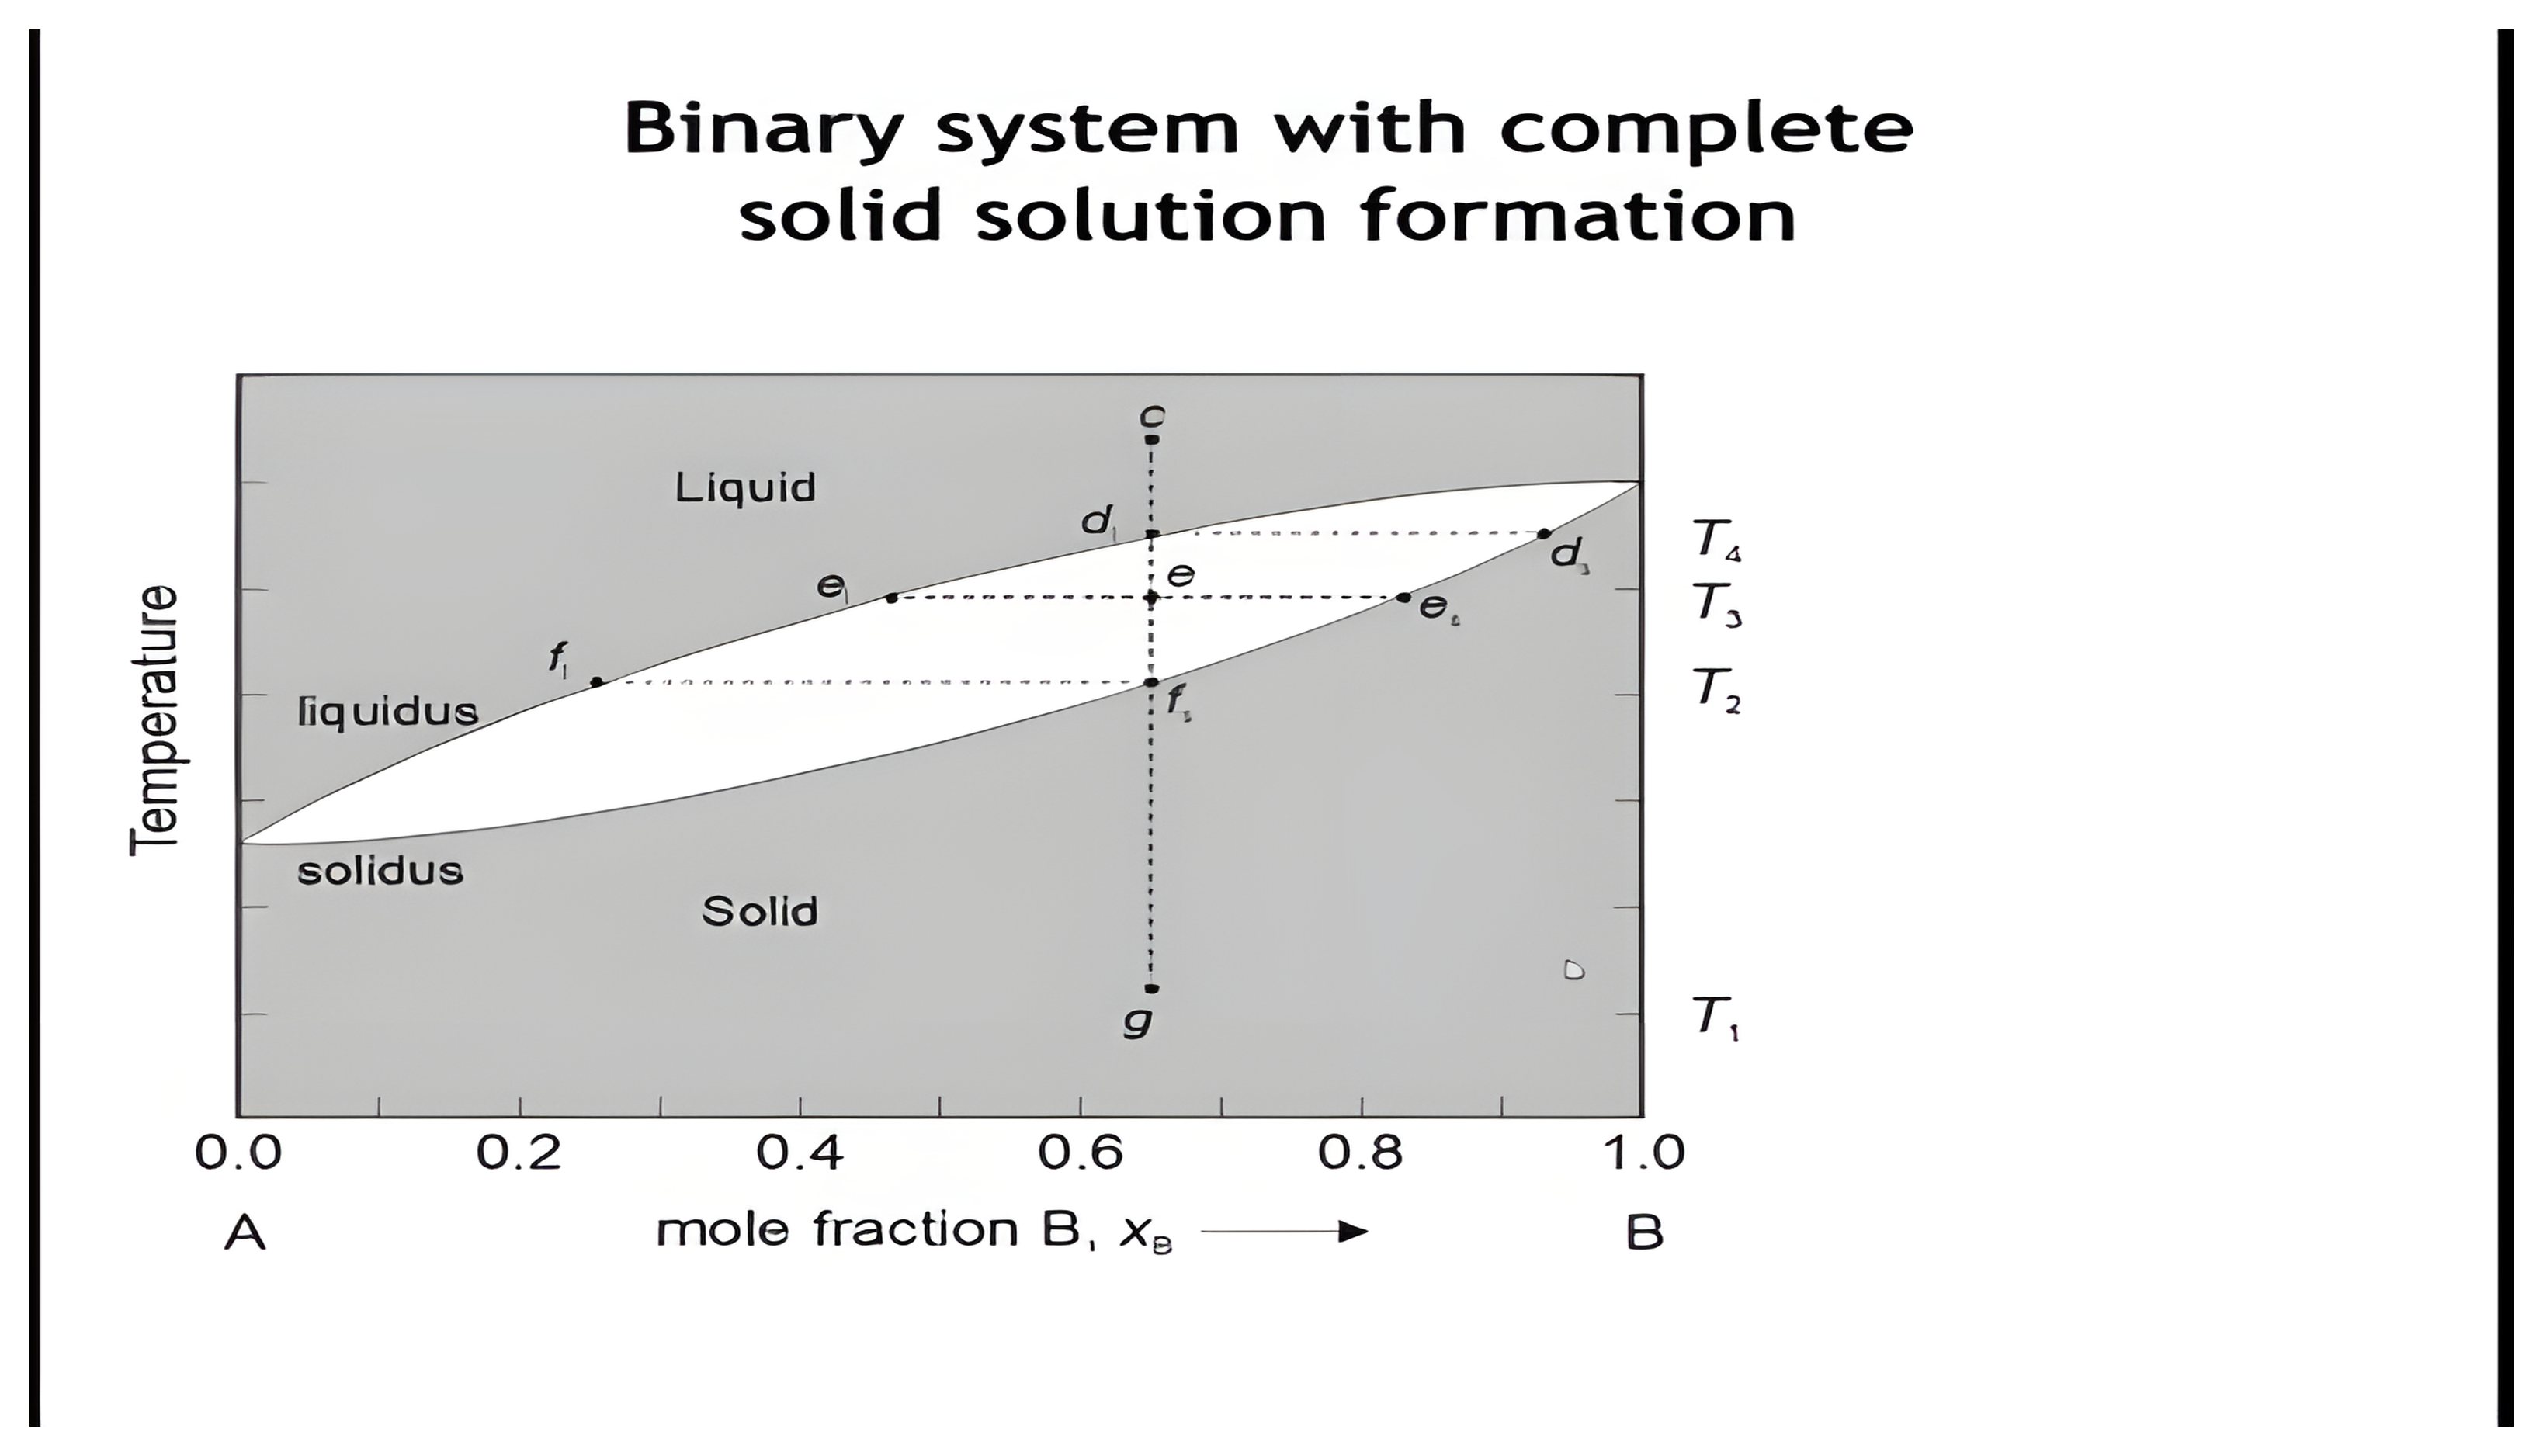
A binary diagram with complete solid solution formation: a lens between the liquidus and solidus with points f, e, d and g marked; advancing annotates the four temperatures of the melting sequence.

Melting from T₁ to T₄

A real solid solution: forsterite and fayalite
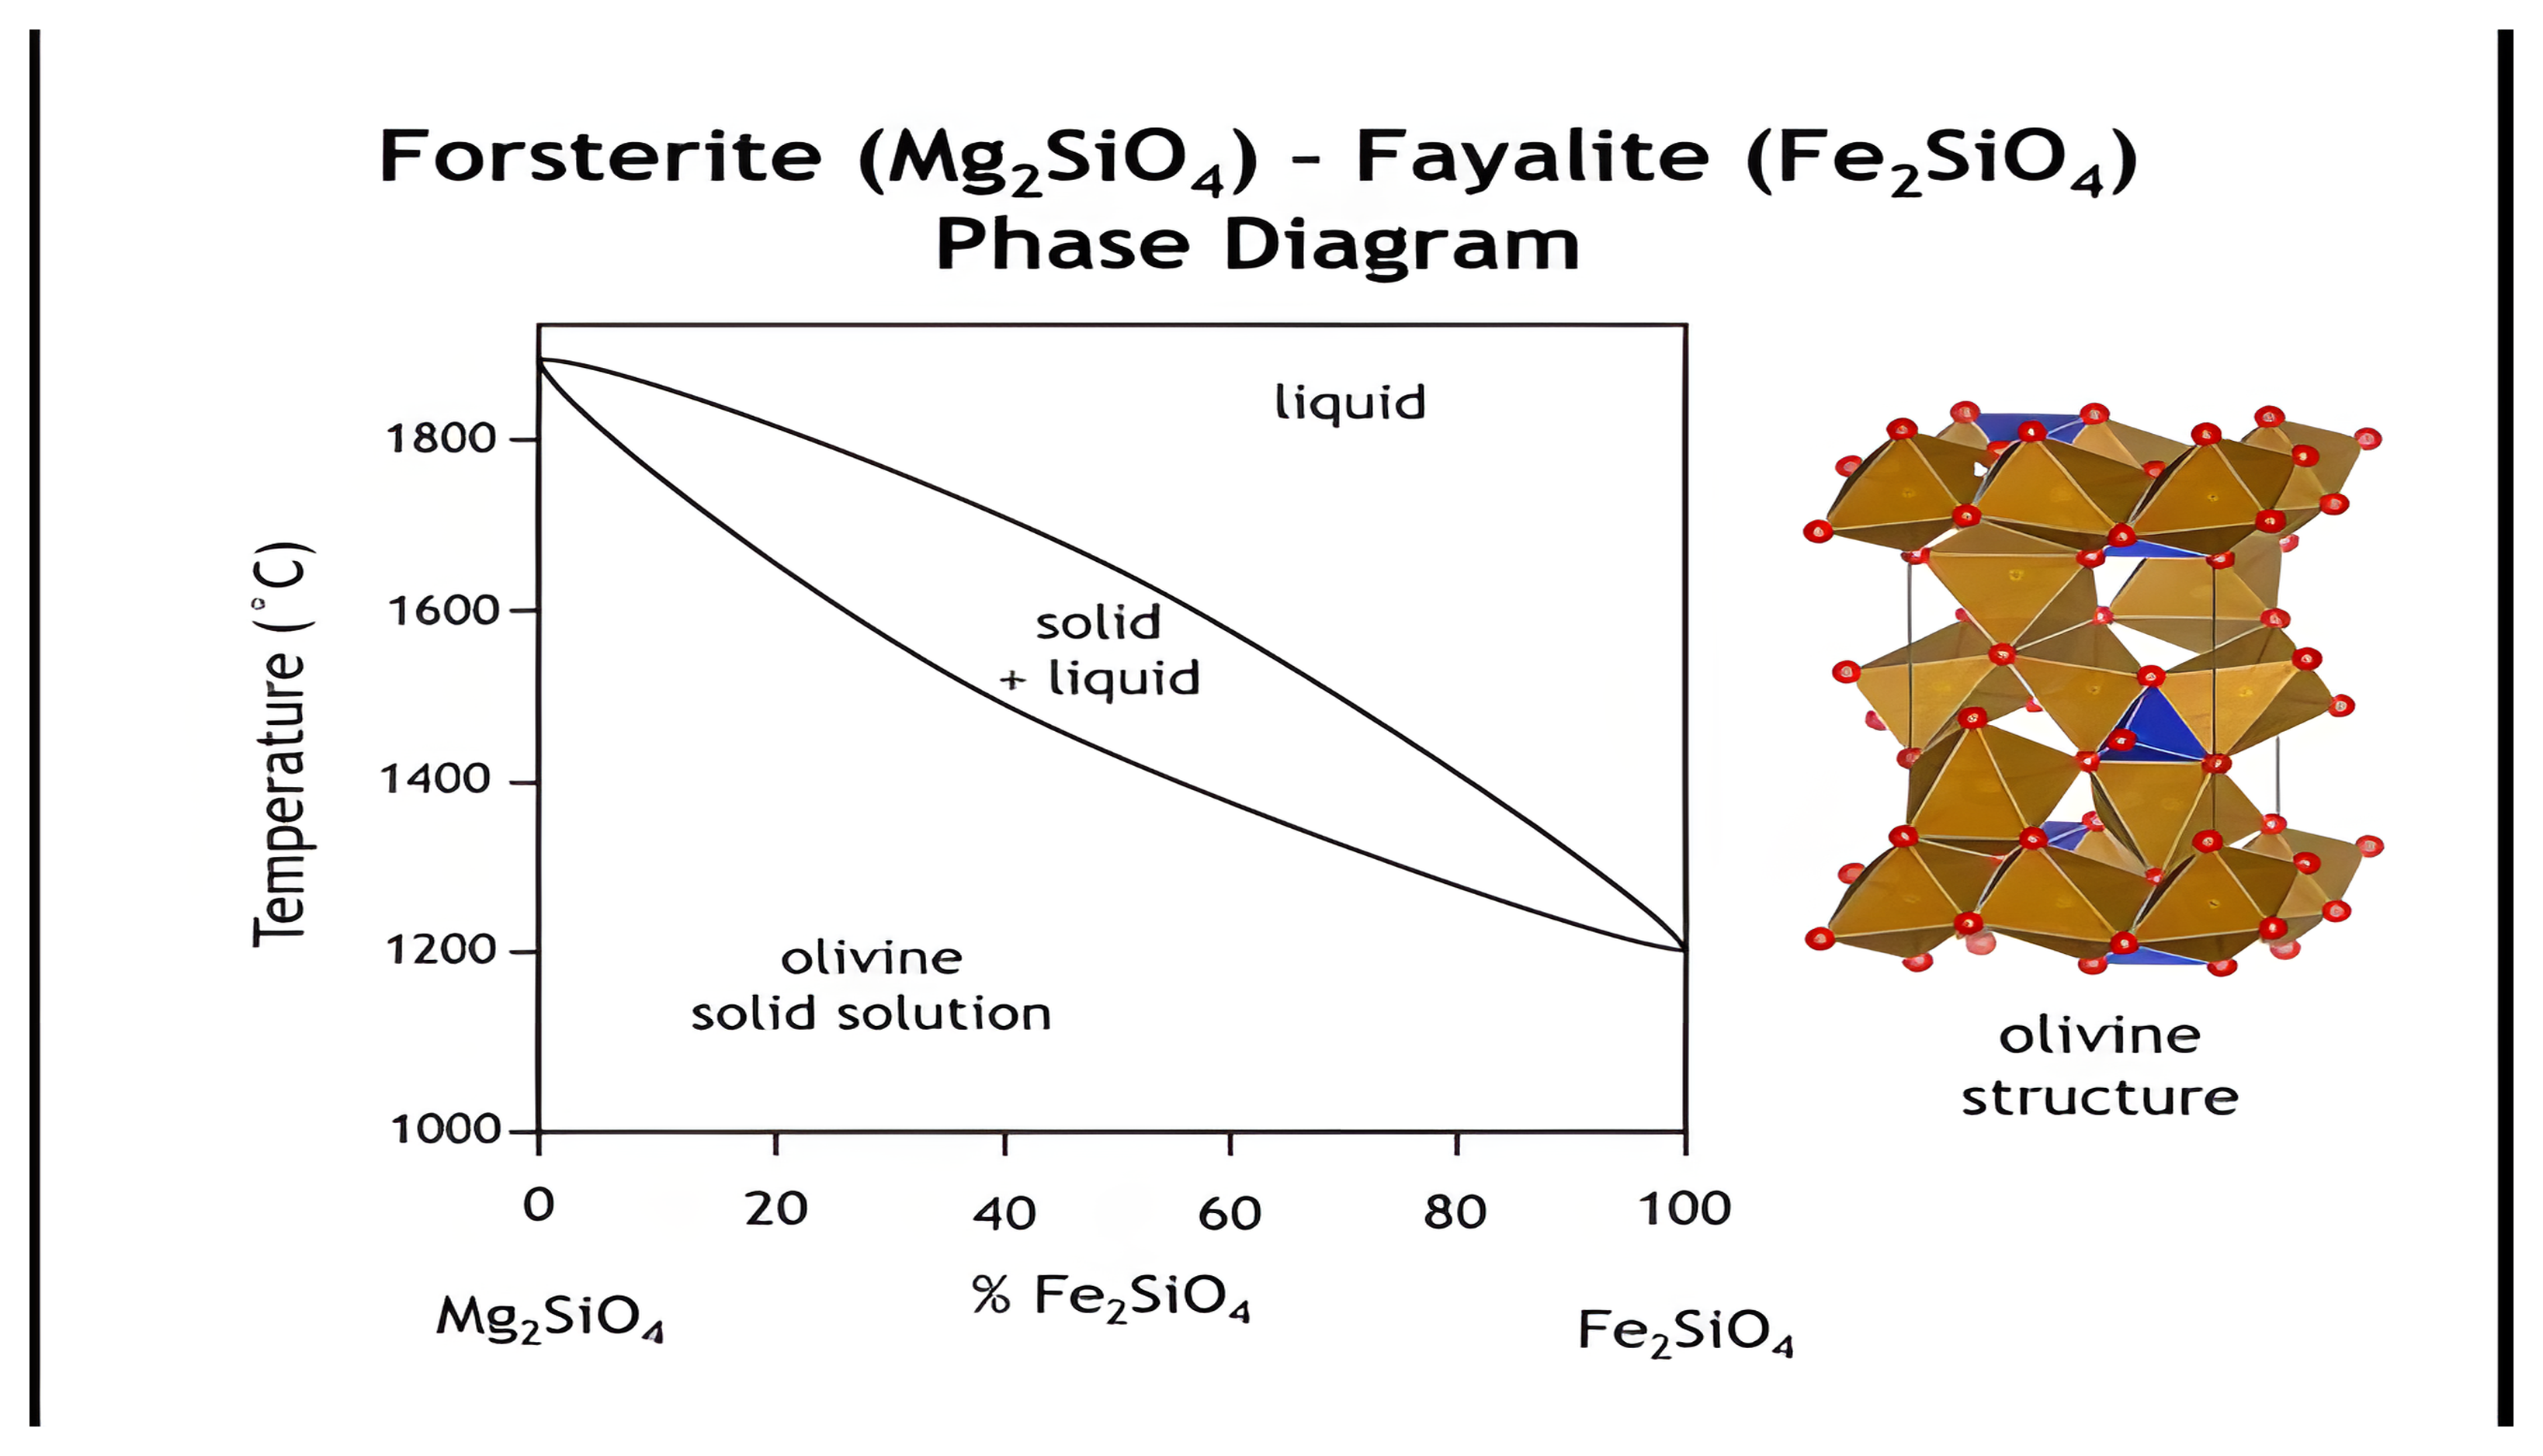
The forsterite to fayalite phase diagram, a narrow liquid-plus-solid lens above the olivine solid-solution field, beside a polyhedral drawing of the olivine structure.

Partial solid solutions, lever rule at point G
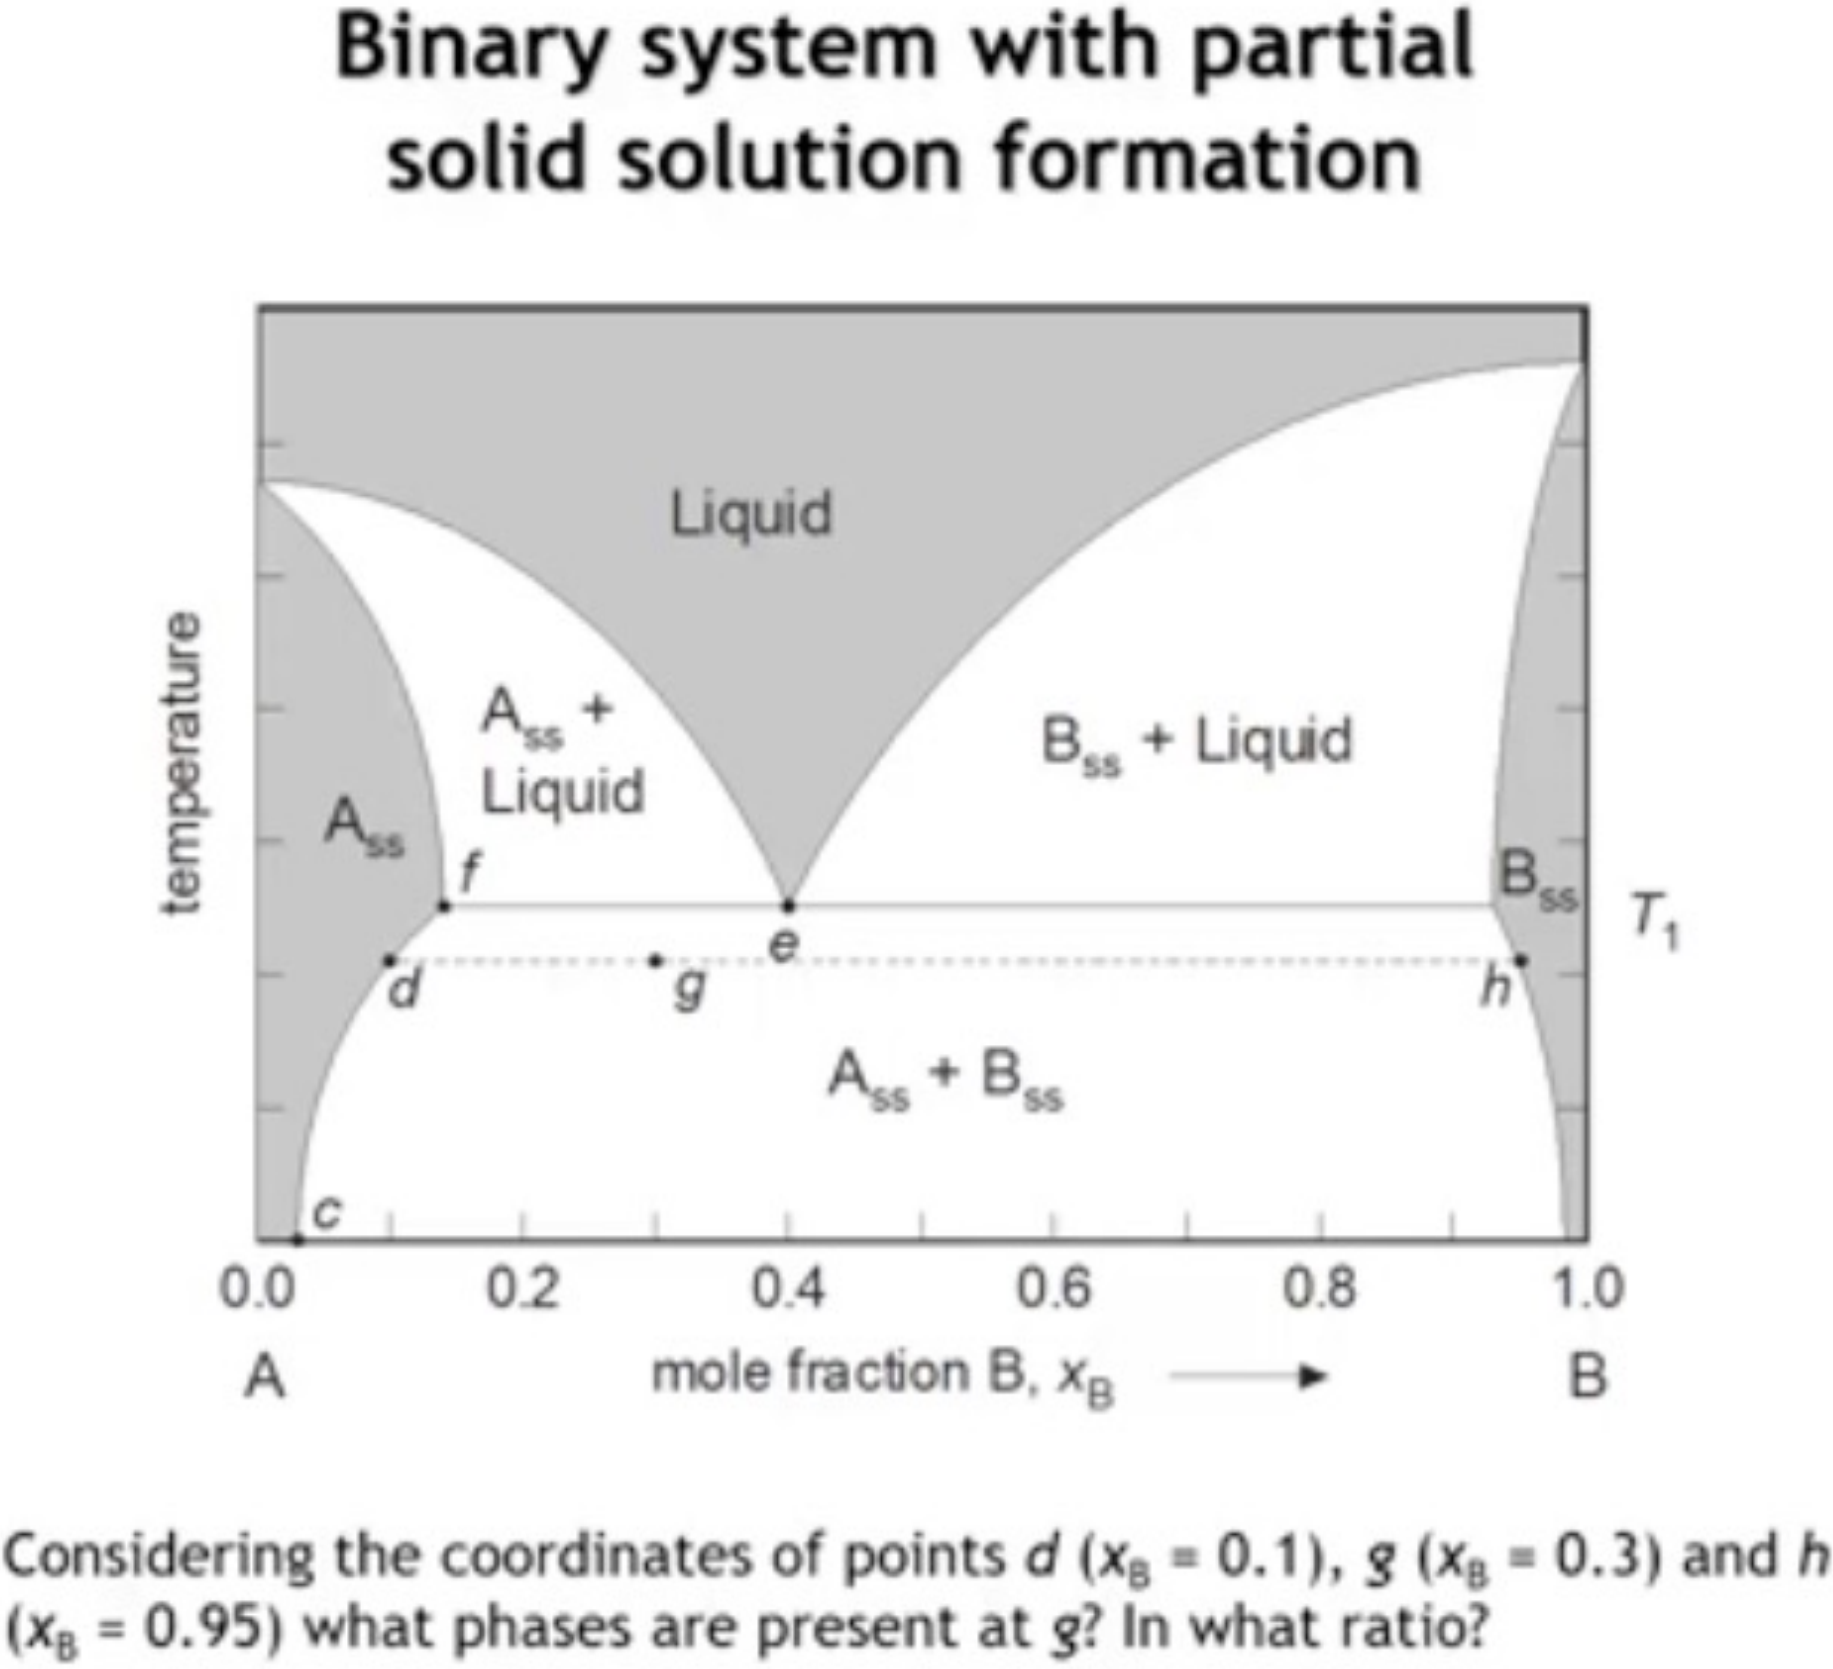
A binary diagram with partial solid solution formation, showing the A-ss and B-ss fields and points d, g and h, and asking which phases are present at g; advancing draws the tie line and then works the lever rule.

Tie line from d to h

The fraction of each phase

A real miscibility gap: MgO and CaO
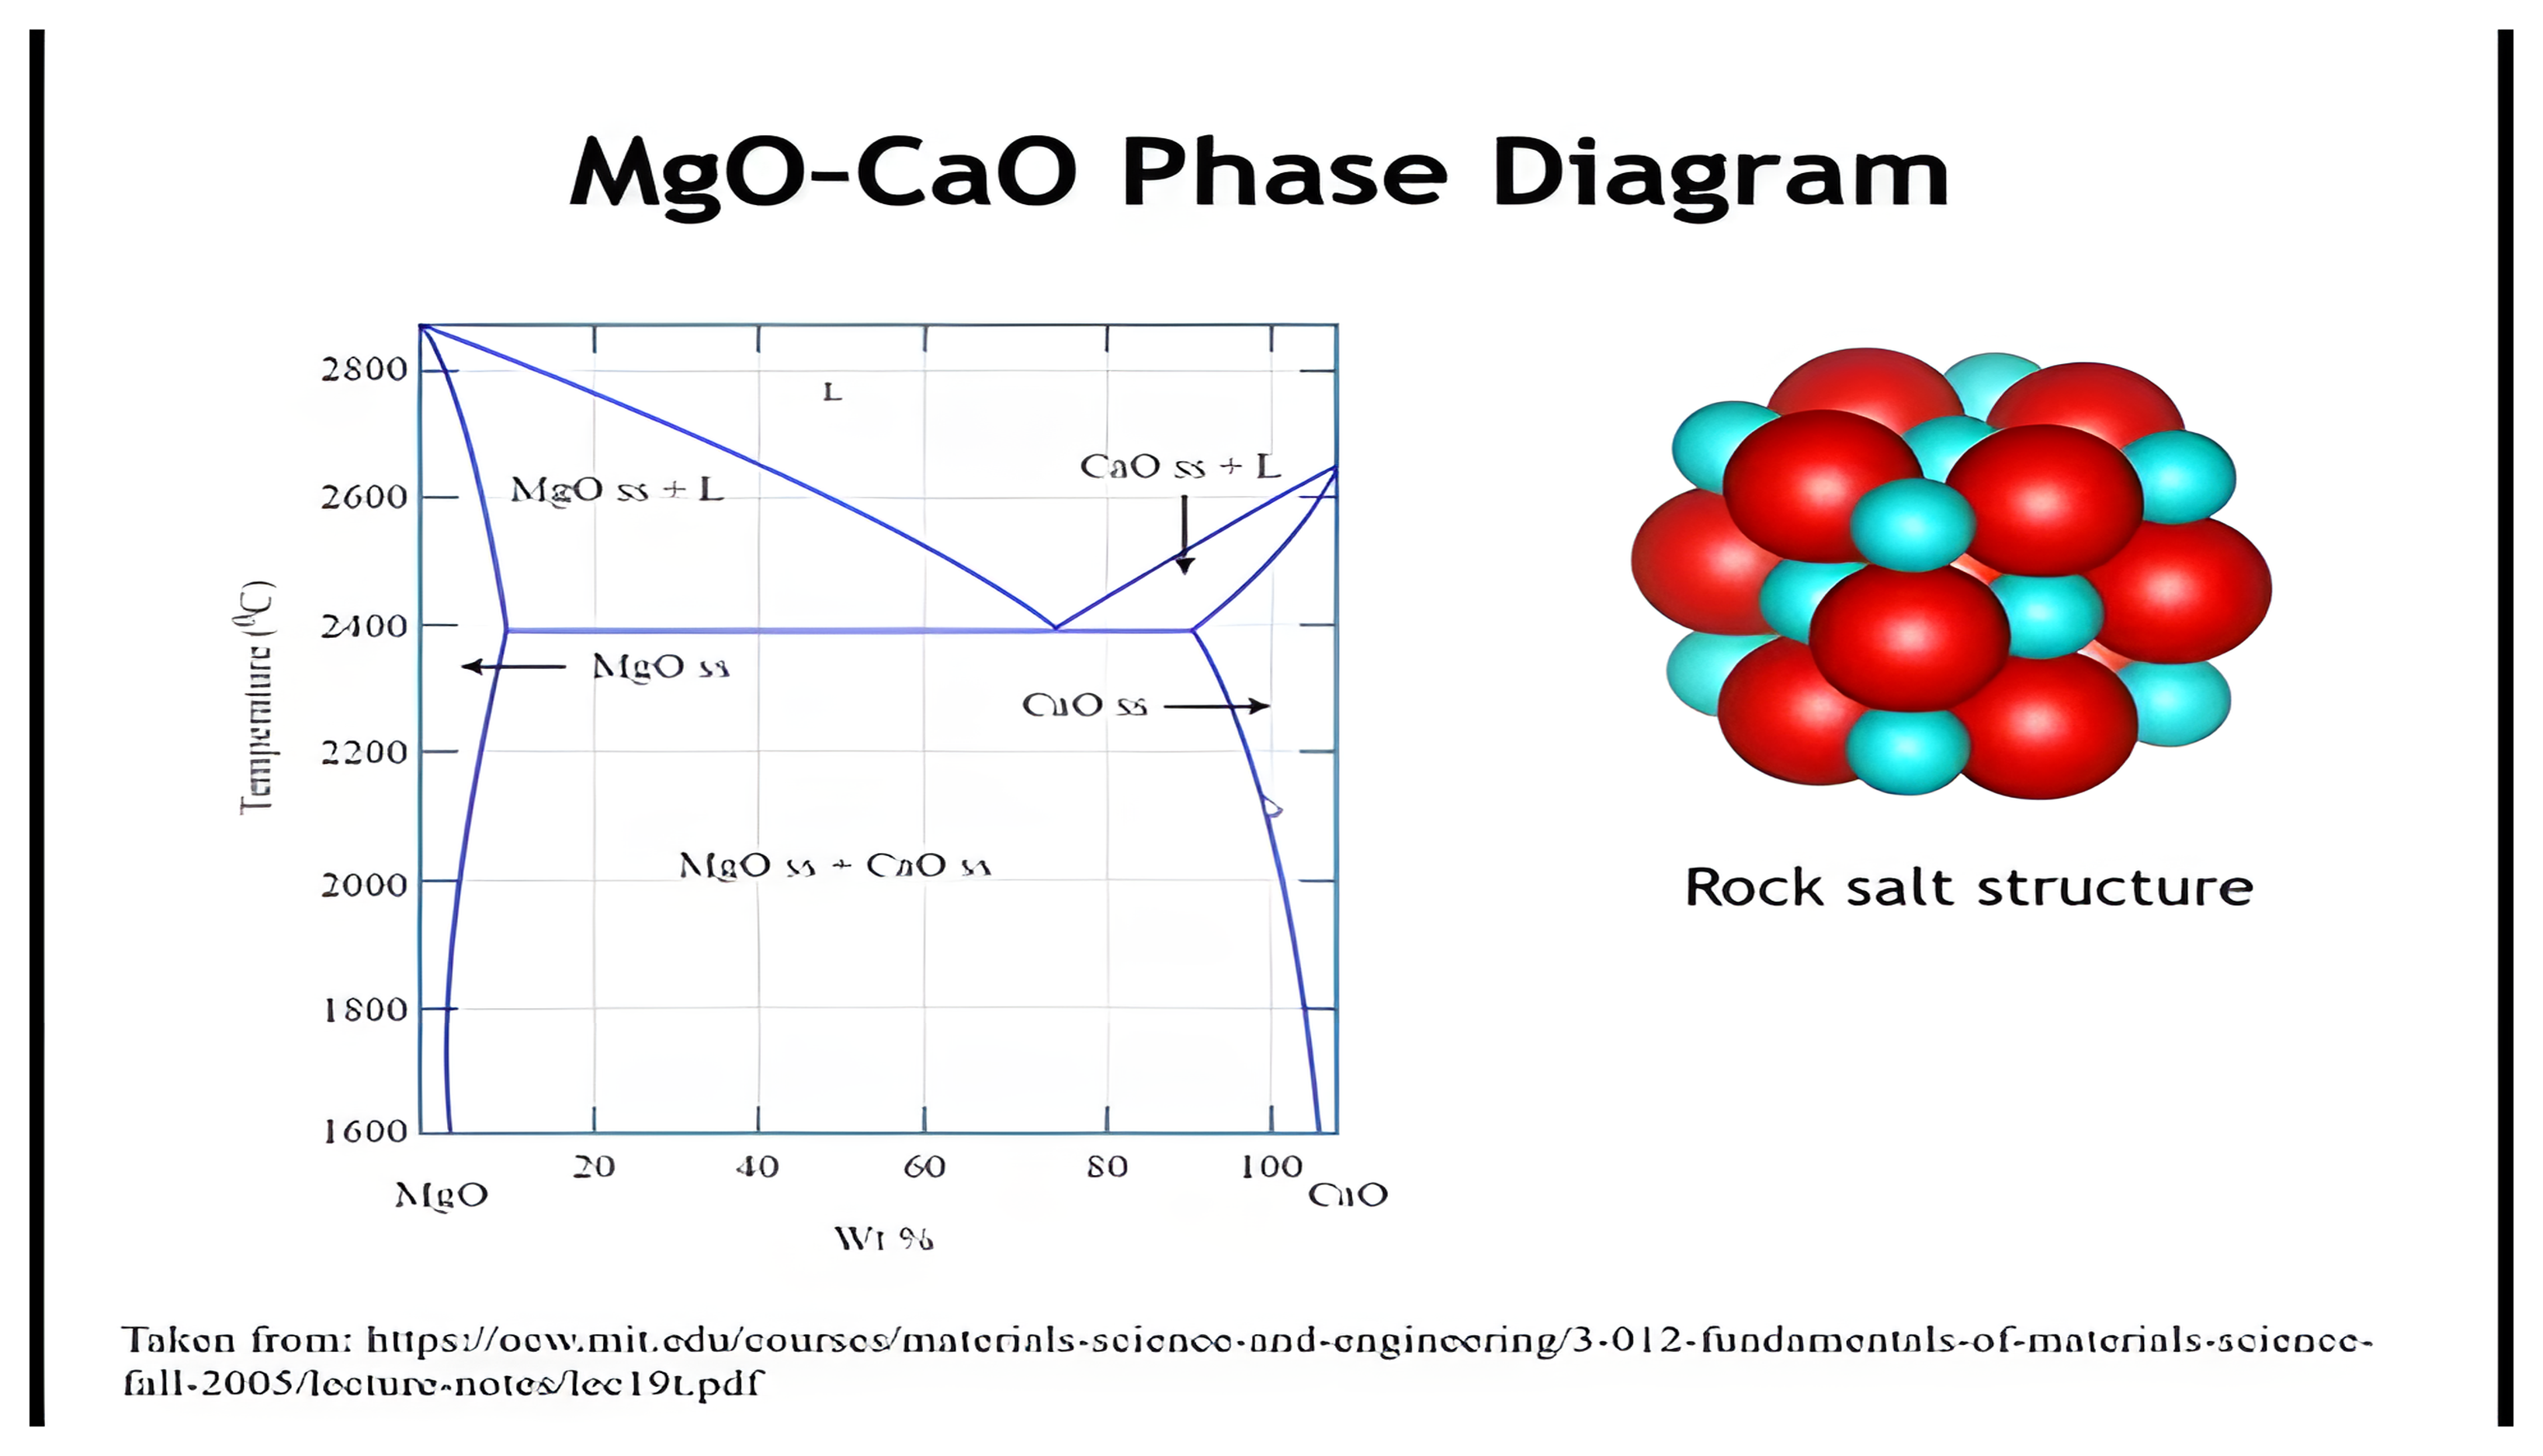
The magnesium oxide and calcium oxide phase diagram with its limited MgO-rich and CaO-rich solid-solution fields and the two-phase miscibility gap between them, beside a rock-salt structure drawing.

Summary: phase diagrams

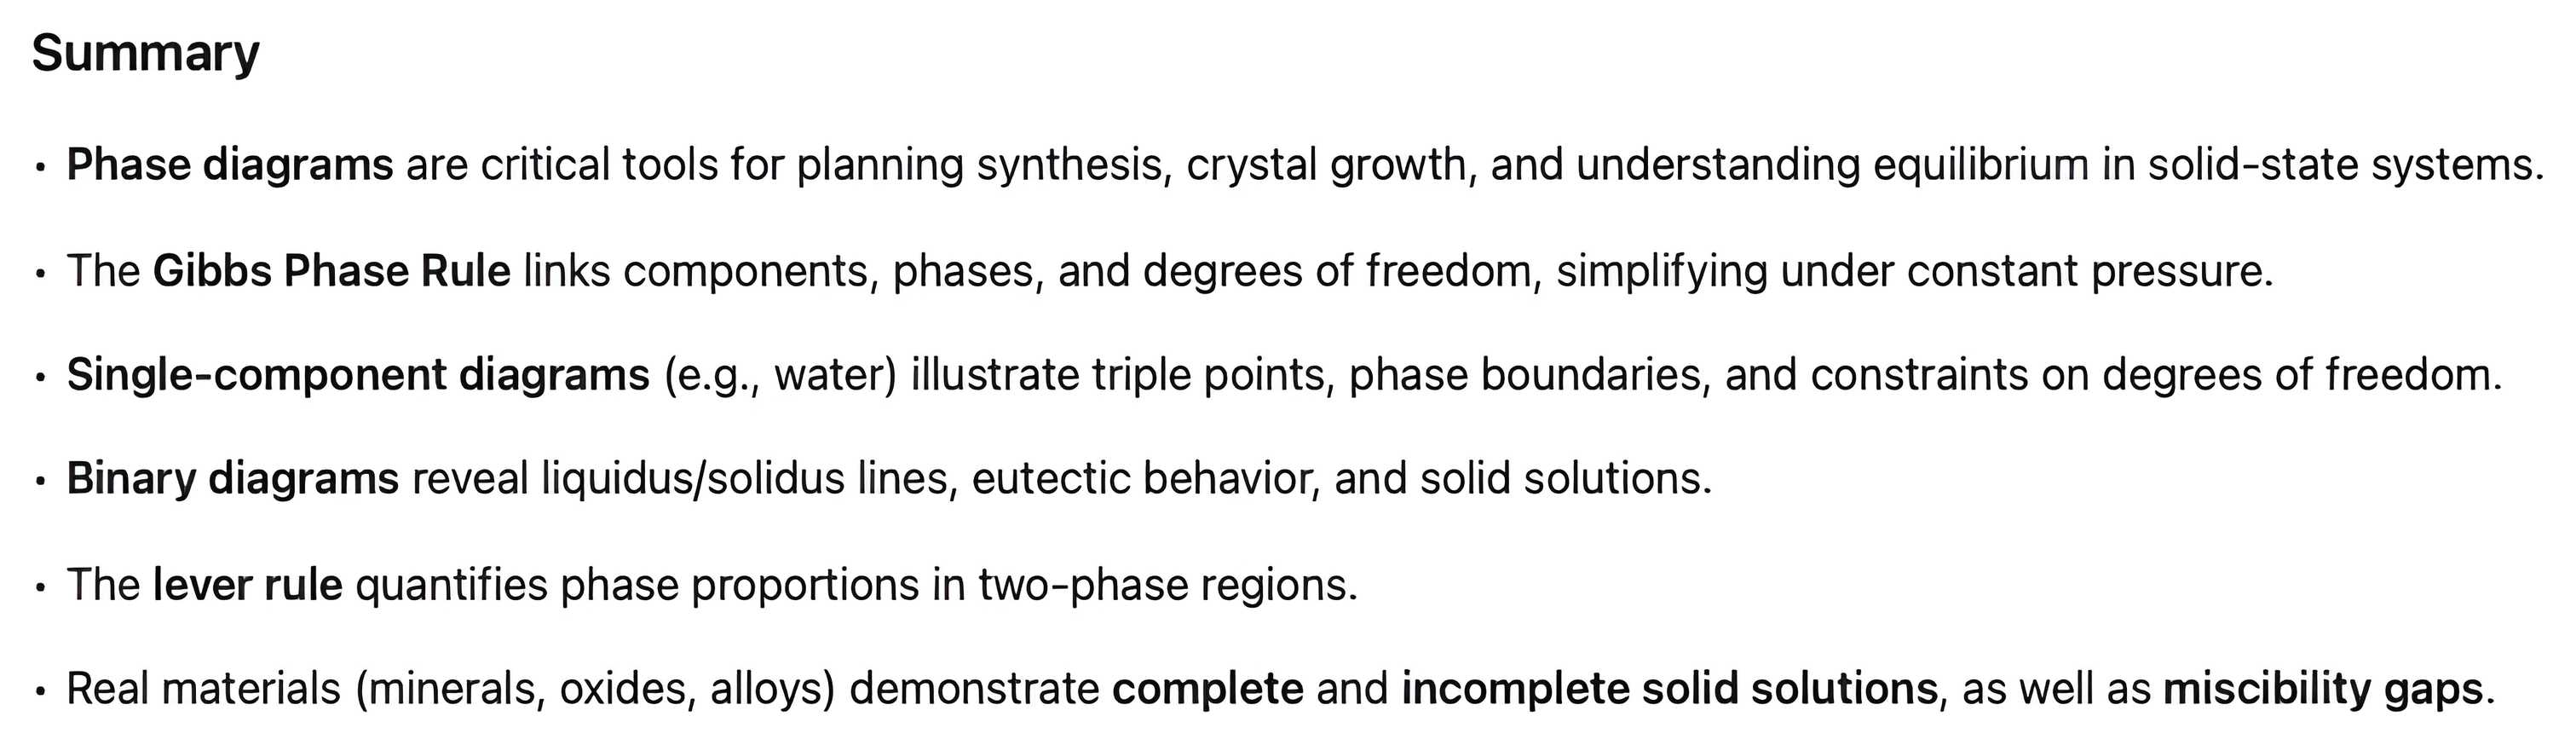
Summary page for phase diagrams, listing their role in synthesis, the Gibbs phase rule, one-component and binary diagrams, the lever rule, and complete and incomplete solid solutions with miscibility gaps.
CHEM 548